Versions Compared

Key

  • This line was added.
  • This line was removed.
  • Formatting was changed.
Comment: Fixed spelling and grammar mistakes


Section

Its a sad fact of life but Tableau

will

probably

not

won't be around forever

Certainly as your company seeks out newer tools and data continues to grow exponentially

The problem is, your company knows this and has built, and continues to build systems in order to progress

...

Expand
titleYou are correct that for the most operations...

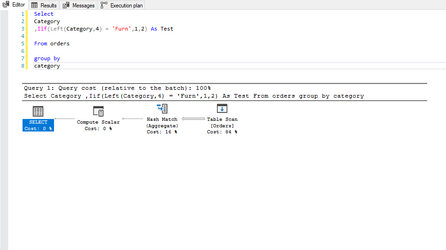
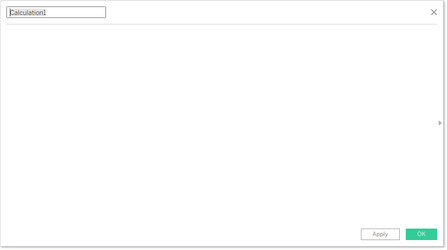
... you will need to create calculations in order for you to provide your analyses however, there are right ways and wrong ways to create calculations with the wrong ways having a detrimental effect to the back-end; however, only through the of the performance recorder will you know for sure the true impacts that you calculations are having.

Classically, consider this calculation:

Code Block
Iif(Left(Category,4) = 'Furn','1','2')

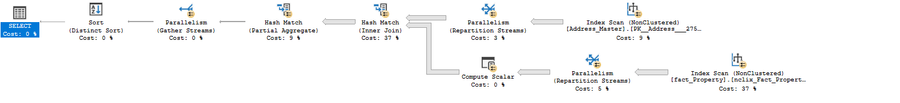
This is the query and execution plan from SQL Server:
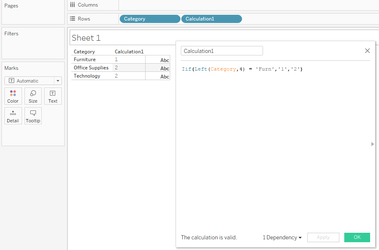
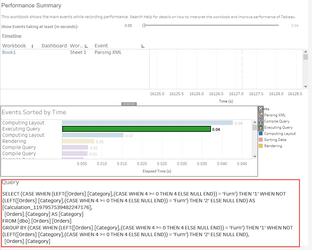
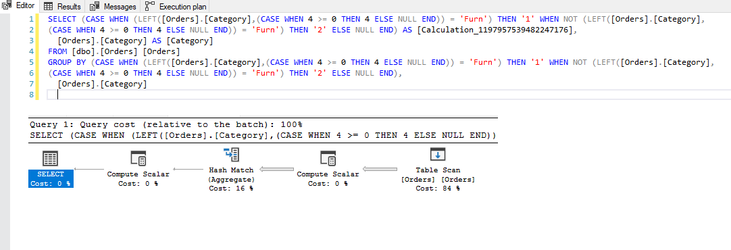
And now in Tableau:

And now in TableauHow Tableau has decided to interpret the calculationAnd the plan of this new expression

Notice the additional operation in the plan?

In this instance, this has resulted in a minimal change on a 9994 row set, but can you imagine the impact this could have on a million / billion or even trillion row set? Moreover, this example uses a table with no performance enhancements which has resulted in a full table scan and hash-match in both queries but crucially, if the table was indexed, the first query would likely be able to use the index to reduce the number of rows to be processed whereas the resultant query Tableau has produced, would mean the index would discarded and a full table scan would be required. 

Moral of the story, yes, calculations are needed, you will be lost without them, but, just ensure the calculations you write perform to their best with minimal impact eg:

  • Try to avoid huge nested case statements by getting to understand the relationship with the logic, this will allow the data-engine to quickly evaluate the statement regardless as to how Tableau re-writes your seemingly beautiful statement
  • Utilise the RAW_ calclautions calculations wherever possible, these are designed to prevent Tableau from re-writing your query
  • Create and test you calculations against the source to ensure they are optimally performant before moving them into Tableau
  • Where possible, utilise external Python and R for complex calculations or when using a database, try to have complicated expressions built to the server a user-defined calculations to move some of the load from the main engine
  • Only create the calculations you need
  • And Never, be afraid to create multiple calculations that make slight alterations - Tableau will only use materialised calculations in its final query so try to avoid "one-size fit's all calculations"


...

Expand
titleBecause it is with CustomSQL...

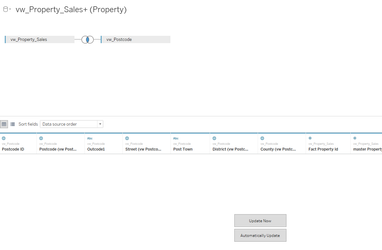
... that you will benefit from the best experience.

See my article About: Custom SQL an in-depth explanation but CustomSQL offers the best performance: As an SQL analyst, you have the tools to be able to write much more performant code, and to test this code and where necessary, gain advice from others about how best to tune the query whereas, simply dragging and dropping the table objects and relying on Tableau to process the fields and connections, means that no-one will be able to optimise the code.

Also, most BI teams make data available through the use of optimised view's rather than direct access to the table so when Tableau executes its connection such as:

The query that Tableau is sending to the database engine will be a variation of:

Code Block
titleTableau Data Model Query
Select
vw_Property_Sales.*
,vw_Postcode.*
From vw_Property_Sales
Join vw_Postcode On vw_Property_Sales.Postcode = vw_Postcode.Postcode

 this view for example:

will generate a query similar to:

Code Block
Select
vw_Property_Sales.County
,Sum(1) As [Number of Records]
From vw_Property_Sales
Join vw_Postcode On vw_Property_Sales.Postcode = vw_Postcode.Postcode

Group By vw_Property_Sales.County

But, where view's are used as is the case here, the actual query that needs to be processed by the database engine will actually look more like:

Code Block
titleTableau View Example
collapsetrue
Select
tableau.County
,Sum(1) As [Number of Records]

From (
	Select
	vw_Property_Sales.fact_property_id
	,vw_Property_Sales.master_Property_ID
	,vw_Property_Sales.Transfer_Date
	,vw_Property_Sales.type_description As Property_Type
	,vw_Property_Sales.New_Build_Flag
	,vw_Property_Sales.Tenure_Type
	,vw_Property_Sales.Price_Paid
	,vw_Property_Sales.Postcode
	,vw_Property_Sales.Primary_House_Name_Number
	,vw_Property_Sales.Secondary_House_Name_Number
	,vw_Property_Sales.Street
	,vw_Property_Sales.Locality
	,vw_Property_Sales.Town
	,vw_Property_Sales.outcode
	,vw_Property_Sales.District
	,vw_Property_Sales.County
	,vw_Postcode.Postcode_ID
	,vw_Postcode.Postcode
	,vw_Postcode.Outcode
	,vw_Postcode.Street
	,vw_Postcode.Post_Town
	,vw_Postcode.District
	,vw_Postcode.County

	From (
		Select
		p.fact_property_id
		,p.master_Property_ID
		,p.Transfer_Date
		,pt.type_description As Property_Type
		,p.New_Build_Flag
		,p.Tenure_Type
		,p.Price_Paid
		,a.Postcode
		,a.Primary_House_Name_Number
		,a.Secondary_House_Name_Number
		,a.Street
		,a.Locality
		,a.Town
		,a.outcode
		,a.District
		,a.County

		From property.property.fact_property p
		Join property.property.Address_Master a On p.Master_Property_ID = a.Property_ID
		Left Join property.property.dim_property_type pt On p.property_type = pt.property_type
	)vw_Property_Sales
	Join (
		Select
		p.Postcode_ID
		,p.Postcode
		,o.Outcode
		,p.Street
		,o.Post_Town
		,o.District
		,o.County

		From postcode.Street_Postcode p
		Join postcode.Outcode_Master o On p.Outcode = o.Outcode
	)vw_Postcode On vw_Property_Sales.Postcode = vw_Postcode.Postcode
)tableau

Group By tableau.County

Which you can see is functionally identical to oft quoted reasons for NOT using CustomSQL.

However, two major points not covered which are generally the most important reasons for using CustomSQL:

  1. Notice that although Tableau is selective as to what data it is requesting, the view unfortunately will need to return all the data and perform in-memory filtering to get to the required data as a view, is simply the result-set of a query
    1. You on the other hand will be able to alter the selection in your query to get only the data you need to satisfy your requirements, even if this means creating multiple bespoke connections; keep in mind that a connection is nothing more than a semantc semantic layer, and will only be made when the data is required from that connection.
  2. Parameterised queries: This neat little function allows for user selection driven data or rather, being able to write dynamic queries that change based on the selections of parameters, means you can create dynamic case statements, have a much elective selective where clause, filtering the source data before other filters are applied on the final result-set etc.

In short, CustomSQL allows you to harness the best from your database with the least amount of impact and to be able better control you data

...

Expand
titleI can't argue with either of those points however...

... consider this calculation to alter the alias of Tenure Type : (running over a 30M row optimised set:

CalcTableau InterpretedResults in this plan


Code Block
Case [Tenure Type]
    When 'F' Then 'Freehold'
    When 'L' Then 'Leasehold'
    Else 'Unknown'
End


Code Block
SELECT (CASE [vw_Property_Sales].[Tenure_Type] WHEN 'F' THEN 'Freehold' WHEN 'L' THEN 'Leasehold' ELSE 'Unknown' END) AS [Calculation_1483936116037431300]
FROM [dbo].[vw_Property_Sales] [vw_Property_Sales]
WHERE ([vw_Property_Sales].[Tenure_Type] = 'F')
GROUP BY (CASE [vw_Property_Sales].[Tenure_Type] WHEN 'F' THEN 'Freehold' WHEN 'L' THEN 'Leasehold' ELSE 'Unknown' END)


Image Modified

Where aliases, being a Tableau object result in no execution time in order to generate the outputs, result is, far faster performance and zero impact to the underlying source.

This object:

is the generally the cause of over 9 in 10 bottle-necks, slowdowns and server impacts yet is also one of the most easiest you can control.

...

Expand
titleAh, the humble quickfilter:

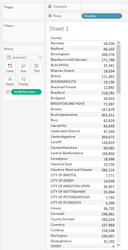
The ideal tool to slice and dice your data.

They can be formed from dimensions, measures and calculations. They can use top n, bottom n, wildcard matching, type in and multi-select. Far more powerful (at least from a basic sense), than parameters, these filters really bring your visualisations to life.

It's true, but these are amongst the biggest culprits for terrible data performance. Yet another one that fails to convey the impact to performance, you see, in order to build a quickfilterquick-filter, Tableau needs to run execute a Select Distinct on the entirety of the column, it matters not whether the table contains a thousand rows, or one-hundred trillion, it still needs to perform this. Net result, as many users routinely plug Tableau into tens and one-hundreds of millions of rows of data, do you have any idea how much processing just one quickfilter quick-filter takes to build.

And then, the source-engine must start again for the next quickfilterquick-filter. So if your table contains 10M rows and you have just five quickfiltersquick-filters, the data engine must run this query once for each filter, touching every record in the set:

Code Block
Select
Field_1 As Quickfilter_1
From YourTable

Group By Field_1

So essentially, the data engine will have touched 50 million records from a 10 million record set. Now do you understand?

There are however, two type of filter that don't touch any records: 

  • type-in allowing users to type their filter:
    • Although you must be very careful with this as this results in a full-text search to filter the records which can be very slow - imagine string matching a partial index to 10 million records.
  • The trusty parameter:
    • A static list that the developer must maintain, having this as a multi-select is just about the only thing that would truly make this but alas, being only single-select is a major turn-off for most users and for good reason too.

I can offer two further solutions that will enable yo to go crazy with your filters: (1.) Either use a parameter to filter your initial set or (2.) Have your filters on just a single page

(1.) The quote I put at the top of this page regarding needing to re-build the r&d report, well, part of the problem was that this was plugged into a 2 billion row set with around 8 quickfilters quick filters that needed to be generated causing huge slow-downs on what was already a 650ms network lag.

However, the r&d entries were all Jira tickets, and frustratingly, users were only interested in a single ticket id each time they were using the report, with the average data size per ticket being around 3 million rows. Ok, so part of the back-end rebuild I mentioned was to partition the data by ticket id which hugely improved performance but, from the front-end, simply converting the connection to CustomSQL with a type-in parameter for the where-clause (this was eventually populated over a url-call) resolved the problem.

Expand
titleHow this worked was...

.. Tableau will not attempt to render any item including quickfilters quick-filters without data, trouble is, an empty parameter meant that no data was being served which means, the report had a chance to open and render (as nothing but headers/footers titles and parameters would still be drawn), and then, once the user enters their ticket id which filters the data from the outset down from 2 billion rows to 3 million rows, the quickfilters quick-filters are then built using the same Select distinct only against a considerably smaller set.

Therefore, by using CustomSQL and a parameter to reduce your set to that which is of interest from the outset, your quickfilters quick-filters can be built against a much smaller set.

(2.) The second alternative I can offer cam about from a pure accident:

A second major drawback of the quickfilter quick-filter is that if the same filter is placed on more than one dashboard or chart page but, enough time passes between initially building the filters on page/dashboard 1, where other actions have taken place enough to clear the cache for the filters, when moving to the alternate pages, the quickfilters quick-filters must be re-generated with the same Select distinct query.

I provided some consultancy to a company who just because they had 20 filters which took-up huge amounts of screen-space so, to save on space, we created a page of filters; it was awkward for the end-user to have to go back to the filters page when they wanted to adjust something, and I had to create an indicator to sit on every page to flag when and which filters were applied, but, the users were happy with it.

Moreover, by moving the quickfilters quick-filters to the one page, this meant that despite their number, they would only have to query the data just once per session, which allowed for an improved experience.

...

Expand
titleSounds simple doesn't it:

Unfortunately, development requests from another user can often cause this very important point to fall by the wayside.

Dashboards need to be as clean as possible - the maxim Less is More is absolutely necessary here.

Tools such as Excel and to a lessor degree, Powerpoint PowerPoint have enabled users to attempt to cram as much information as possible into the tiniest of spaces. Users have been brought-up on a diet of "All on one page". This is terrible, for a number of reasons:

  • First of all, this is far too much information for users to consume and keep track of
  • Dashboards quickly lose focus so end-up a mess of disorganised charts that hide or worse, lose them message
  • Imagine you have an odd data point that needs investigation, trying to trace this through multiple charts can often lead to losing the point or, by the time the user reaches chart 9, they are more likely to have forgotten the reason for the investigation
  • Finally and most importantly, much charts on a screen quickly leads to performance degradation:
    • At best, a chart may be made of two components: a dimension and a measure. These need to be executed as a query, and plotted taking at least 5 operations:
      • Tableau generates the initial query and send to the data-server
      • The data engine executes the query
      • Data is returned back to Tableau
      • Tableau reads the data and identifies which objects are to be plotted where
      • Tableau plots the data
    • Tableau must follow the above steps regardless as to the number of marks to plot and furthermore, need to do this for every chart so if you have 15 charts on a page, then this needs to happen 15 times, which is a huge amount of work
    • Worse (what could be worse than this?), as you build interactivity into your dashboard such as filters, parameters and action filters, each of these items generate a new query each time a change needs to be computed

Visuals (charts and tables) also need to be as clean as possible. The less ink on the page, the easier a chart is to read:

  • Use the most simplest design to get the message across: there's no denying a beautifully crafted info-chart can look like a work of art in its own right, however, such charts are designed to beautify data with a single message in mind such that they often lose out to more simplistic bars and line charts
  • Colour can allow you to add another dimension to your data
  • But keep your design clean and simple; the more data you cram onto your chart, the easier your audience will lose track of the message
  • Most importantly, the more data that has been crammed onto a chart, the more processing that needs to be done in order to build the chart, so only include that which is necessary for you to present the message.

...