| Section |
|---|
Its a sad fact of life but Tableau probably won't be around foreverCertainly as your company seeks out newer tools and data continues to grow exponentiallyThe problem is, your company knows this and has built, and continues to build systems in order to progress |
It is very rare, and in most cases, improbable that your Tableau reports and analyse's analyses will consume data from a dedicated for-Tableau optimised data-warehouse, at best, you can hope that a warehouse for visualisation be made available, although most of the time, you will be consuming the same data as everyone else, such that unless you are a member of the BI team, or have ddl (Data Definition Language) access to the databases (required to create and optimise tables, views, etl etc), the chances are, you may not have a chance to optimise the back-end.
...
| Section |
|---|
|
I remember my Family Law lecturer when studying for my degree making the point that really, the subject should be called anti-family law as we spend more time trying to find the best approach to amicably break the family apart rather than creating one and/or keeping it together.
Using Tableau is no different: In order to ensure we as developers are getting the best from Tableau, we really need to be asking "is this method the best way to achieve this" or "is Tableau the best tool for the job" or "do we actually need this" and finally "I'm sure we can demonstrate this more simply than that"
Data drives everything.
Including your reports, but data is not always optimised for the job in-hand, and is often unable to be, so really you should see data and data performance as the main drivers behind your reports, don't try and over-wrangle Tableau.
...
| Child pages (Children Display) | ||||
|---|---|---|---|---|
|
Finally, this is my list of items to consider for best practice for all of your analyses and dashboards:
| Table of Contents | ||||
|---|---|---|---|---|
|
(1.) Only use calculations when you need them:
But calculations are Tableau's bread-and-butter aren't they? What can I possibly do if I cannot write calculations?
| Expand | ||||||||
|---|---|---|---|---|---|---|---|---|
| ||||||||
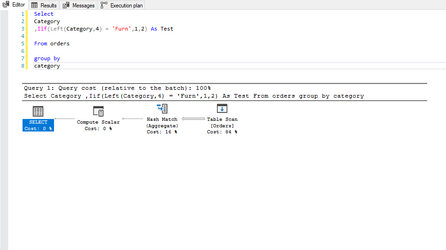
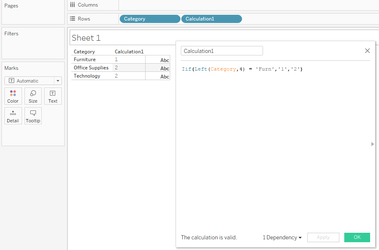
... you will need to create calculations in order for you to provide your analyses however, there are right ways and wrong ways to create calculations with the wrong ways having a detrimental effect to the back-end; however, only through the of the performance recorder will you know for sure the true impacts that you calculations are having. Classically, consider this calculation:
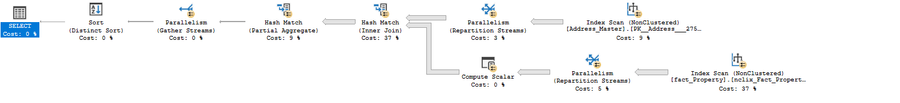
This is the query and execution plan from SQL Server:
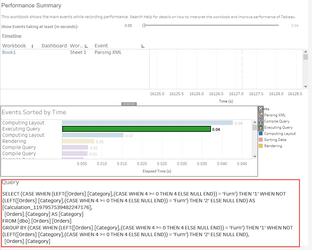
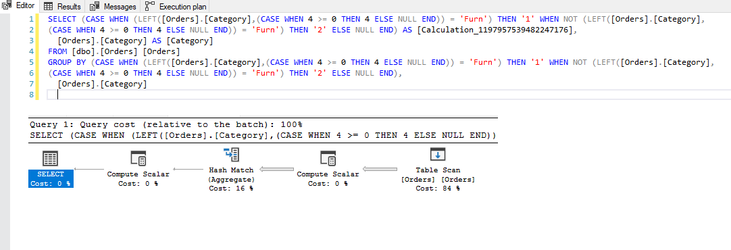
And now in Tableau:
Notice the additional operation in the plan? In this instance, this has resulted in a minimal change on a 9994 row set, but can you imagine the impact this could have on a million / billion or even trillion row set? Moreover, this example uses a table with no performance enhancements which has resulted in a full table scan and hash-match in both queries but crucially, if the table was indexed, the first query would likely be able to use the index to reduce the number of rows to be processed whereas the resultant query Tableau has produced, would mean the index would discarded and a full table scan would be required. Moral of the story, yes, calculations are needed, you will be lost without them, but, just ensure the calculations you write perform to their best with minimal impact eg:
|
(2.) Wherever possible ALWAYS use CustomSQL
Hold on a moment, the majority of the articles available online and other Tableau users generally advise to avoid CustomSQL and utilise the Tableau data-model, but you are telling me the exact reverse - why?
| Expand | ||||||||||||||
|---|---|---|---|---|---|---|---|---|---|---|---|---|---|---|
| ||||||||||||||
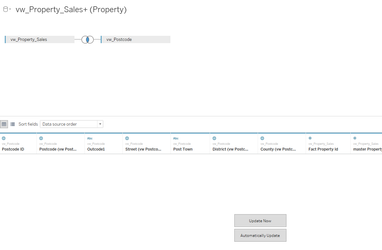
... that you will benefit from the best experience. See my article Lets Talk: Custom SQL an in-depth explanation but CustomSQL offers the best performance: As an SQL analyst, you have the tools to be able to write much more performant code, and to test this code and where necessary, gain advice from others about how best to tune the query whereas, simply dragging and dropping the table objects and relying on Tableau to process the fields and connections, means that no-one will be able to optimise the code. Also, most BI teams make data available through the use of optimised view's rather than direct access to the table so when Tableau executes its connection such as:
The query that Tableau is sending to the database engine will be a variation of:
this view for example:
will generate a query similar to:
But, where view's are used as is the case here, the actual query that needs to be processed by the database engine will actually look more like:
Which you can see is functionally identical to oft quoted reasons for NOT using CustomSQL. However, two major points not covered which are generally the most important reasons for using CustomSQL:
In short, CustomSQL allows you to harness the best from your database with the least amount of impact and to be able better control you data |
(3.) Avoid nesting and materialise wherever possible
Ok, I think I understand this one, instead of writing nested queries, you suggest I should create separate calculations for what would be the nested calculations? Why, surely this will lead to more processing
| Expand | ||
|---|---|---|
| ||
... a marginal rise, although, there are two more important reasons for this: 1.Reading point 1 above, Tableau has a tendency to convert even the most simplest of queries into considerably more complicated queries which can, and generally speaking do impact data-server resource, and more frustratingly, cause the data server to disregard indexes and other performance optimisations that may have nee applied to the table, so writing individual calculations, will cause these to be processed in a separate transaction. 2.Secondly, nesting calculations rather than pre-materialising the outputs can lead to calculation errors, as Tableau is only able to consider the data in the view as being the partition eg: Assume you are wanting the average sum across the complete set of 200M rows of data, but your sample contains only 20,000, this average could therefore be incorrect. Now, this could be easily resolved with a correctly-scoped level-of-detail calculation, however, this would mean your calculation is unnecessarily unique, making your documentation unnecessarily complicated too |
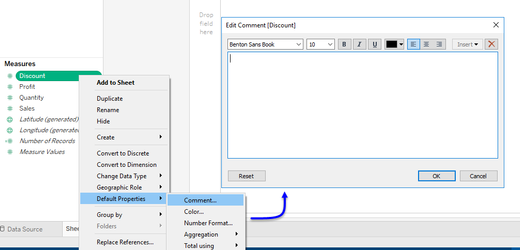
(4.) Use Tableau built-in functions (aliases, groups, sets, bins etc) wherever possible instead of calculations or make the changes in CustomSQL
But calculations are easier and aliases / groups / bins etc may be single-use
| Expand | ||||||||||
|---|---|---|---|---|---|---|---|---|---|---|
| ||||||||||
... consider this calculation to alter the alias of Tenure Type : (running over a 30M row optimised set:
Where aliases, being a Tableau object result in no execution time in order to generate the outputs, result is, far faster performance and zero impact to the underlying source. This object:
is the generally the cause of over 9 in 10 bottle-necks, slowdowns and server impacts yet is also one of the most easiest you can control. |
(5.) Always test the performance using the performance recorder
| Note | ||
|---|---|---|
| ||
The recorder simply records all Tableau events to help you identify performance issues. The recorder is NOT a screen-capture device: it will not record screen activity, webcam or microphone and all recorded activity is saved locally. |
...
| Expand | ||
|---|---|---|
| ||
... will tell you everything you need to know about what Tableau and thereby, the data-server is needing to do to build your visual. It can be accessed from Help > Settings and Performance > Start Performance Recording to start recording actions, and then returning to the same location and selecting Stop Performance Recording when you are ready to review. I would recommend you also use the Tableau Server performance recorder when publishing extracts after you have tuned using the desktop version, to ensure your server and web pipeline are also optimal. This is reached by first activating the toolbar with this url command: Open the workbook you want to test onto the first chart you want eg: https://tableau.com/#/divisionsite/financeanalytics/views/fiscal_performance/HighLevelSummary?:iid=1 and replace the ":iid=1" with ":record_performance=yes" Once active, you will be able to start and stop recording at will and recording is continuous unlike the desktop recorder where only actions that take place between explicit start and stop points are recorded, allowing for better traceback facility. |
(6.) Understand your use-case carefully and consider the best methods for connecting to your data
| Expand | ||
|---|---|---|
| ||
Understanding usage frequency, data-size and complexity are the three considerations you need to make when choosing the best connection method. Generally speaking the Direct connection is often the best as you can ensure:
Although, this too has other considerations:
Hyper extracts by comparison offer a safe medium however, by offering mostly the reverse of the direct connect method. However, keep in mind that extracts:
Finally, Published extracts. Published extracts can exist as either extracted data-sets like Hyper Extracts or can simply be a published data-source holding the connectivity information to a Direct-connect data-source. They function near identical to their workbook-base counterparts only being server based, they provide the addition of accessibility allowing all users to connect and use the same source as you are using. But, published extracts and sources are not also without their issues and should still only be used following careful consideration.
|
(7.) Additive Calculations belong in the source
| Expand | ||
|---|---|---|
| ||
... should exist in the source. Remembering the maxim: Less is More And expanding on point 1 above: Regardless as to the source, be it Excel or a flat-file, or a database table, calculations that operate on a row-by-row basis and these even include numerators and denominators of ratio calculations, can and therefore should be materialised in the source. If you are unable to modify the source table, this is the perfect time to use CustomSQL. By pre-materialising your base numbers at the source level, you are significantly increasing performance on the presentation layer (Tableau). Examples of such calculations include:
|
(8.) Understand Tableau's role
| Expand | ||
|---|---|---|
| ||
.. a presentation layer. All too often, Tableau is given Excel-centric nicknames "Excel on steroids" or "a more powerful Excel tool", and many of Tableau's user-base began there analytical lives with Excel or a similar spreadsheet tool, as such, most people therefore try to gain the same results from Tableau that they see with Excel, which often leads to terrible results further down the line. Tableau is NOT Excel and it does not behave like Excel either. The problem comes from the ease of use that Tableau provides, and users failing to understand the architecture of both tools. Only when explained that Tableau is nothing more than a presentation-layer with the bulk of the heavy-lifting taking place outside of Tableau, compared to Excel which does process every action, do users begin to see the bigger picture. This is discussed in greater detail in Tableau Overview: for the Excel User |
(9.) Limit your use of filters
Are you kidding? If I don't have filters, my charts and dashboards will become unusable! It was only a matter of time before these ended-up on your list - killjoy!
| Expand | |||||||
|---|---|---|---|---|---|---|---|
| |||||||
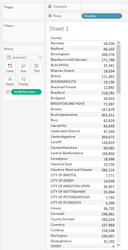
The ideal tool to slice and dice your data. They can be formed from dimensions, measures and calculations. They can use top n, bottom n, wildcard matching, type in and multi-select. Far more powerful (at least from a basic sense), than parameters, these filters really bring your visualisations to life. It's true, but these are amongst the biggest culprits for terrible data performance. Yet another one that fails to convey the impact to performance, you see, in order to build a quick-filter, Tableau needs to execute a Select Distinct on the entirety of the column, it matters not whether the table contains a thousand rows, or one-hundred trillion, it still needs to perform this. Net result, as many users routinely plug Tableau into tens and one-hundreds of millions of rows of data, do you have any idea how much processing just one quick-filter takes to build. And then, the source-engine must start again for the next quick-filter. So if your table contains 10M rows and you have just five quick-filters, the data engine must run this query once for each filter, touching every record in the set:
So essentially, the data engine will have touched 50 million records from a 10 million record set. Now do you understand? There are however, two type of filter that don't touch any records:
I can offer two further solutions that will enable yo to go crazy with your filters: (1.) Either use a parameter to filter your initial set or (2.) Have your filters on just a single page (1.) The quote I put at the top of this page regarding needing to re-build the r&d report, well, part of the problem was that this was plugged into a 2 billion row set with around 8 quick filters that needed to be generated causing huge slow-downs on what was already a 650ms network lag. However, the r&d entries were all Jira tickets, and frustratingly, users were only interested in a single ticket id each time they were using the report, with the average data size per ticket being around 3 million rows. Ok, so part of the back-end rebuild I mentioned was to partition the data by ticket id which hugely improved performance but, from the front-end, simply converting the connection to CustomSQL with a type-in parameter for the where-clause (this was eventually populated over a url-call) resolved the problem.
Therefore, by using CustomSQL and a parameter to reduce your set to that which is of interest from the outset, your quick-filters can be built against a much smaller set. (2.) The second alternative I can offer cam about from a pure accident: A second major drawback of the quick-filter is that if the same filter is placed on more than one dashboard or chart page but, enough time passes between initially building the filters on page/dashboard 1, where other actions have taken place enough to clear the cache for the filters, when moving to the alternate pages, the quick-filters must be re-generated with the same Select distinct query. I provided some consultancy to a company who just because they had 20 filters which took-up huge amounts of screen-space so, to save on space, we created a page of filters; it was awkward for the end-user to have to go back to the filters page when they wanted to adjust something, and I had to create an indicator to sit on every page to flag when and which filters were applied, but, the users were happy with it. Moreover, by moving the quick-filters to the one page, this meant that despite their number, they would only have to query the data just once per session, which allowed for an improved experience. |
(10.) Keep your visuals clean and your dashboards focused
| Expand | ||
|---|---|---|
| ||
Unfortunately, development requests from another user can often cause this very important point to fall by the wayside. Dashboards need to be as clean as possible - the maxim Less is More is absolutely necessary here. Tools such as Excel and to a lessor degree, PowerPoint have enabled users to attempt to cram as much information as possible into the tiniest of spaces. Users have been brought-up on a diet of "All on one page". This is terrible, for a number of reasons:
Visuals (charts and tables) also need to be as clean as possible. The less ink on the page, the easier a chart is to read:
|
(11.) Keep your work-space tidy
| Expand | ||
|---|---|---|
| ||
|
...