Question: What is one of the most powerful features available in the Tableau toolkit?
Parameters are just about as close as Tableau gets to providing out-of-the-box programming functionality.
Unlike many of the other functions in Tableau, only parameters have the ability to both hold a value, and make that value available for direct use, and what's more, is that only parameters are global, they are completely accessible by any data source, which means that you can easily control one data source from another without defining a relationship such as when blending sources, or, by renaming fields in order to allow for cross-source filtering.
Since my Tableau journey began many years ago, being the data analyst and engineer that I am, parameters were my go-to function, yet sadly, they appear to be the unsung hero of the interactive visualisation, often with users failing to realise their true power, hence this article:
I really want to demonstrate to you just how powerful they are, and some of the ways you can really bring your visualisations to life
It's no secret, sure I can put some great dashboards together just like the rest of you, though for me, I've always been a fan of giving my users as much data as they can handle, and letting them define their own stories, but sadly, many users begin to use Tableau from entirely the wrong angle.
I've said it before: you may well have the most awesome dashboard ever seen, but if it takes 45 seconds to render, this is 41 seconds in which your audience has checked their watch, and moved off; it is too slow.
Performance is the key, users would much rather look at a terrible dashboard that turns around in 3 seconds, than spend more than 10 seconds waiting for awesomeness to load; and then, put off by how long it took to load, users will avoid interaction as much as possible therefore, some of the best chances to identify the greatest stories will have been lost.
Can you imagine a world without Romeo & Juliette - I can, being English I had to study this to death, but still, had Shakespeare failed to tell the story, we would probably now have 'Gordon and that bit of stuff he met in the pub last Friday night'.
Parameters, allow you to really control most aspects of your visualisation from a very simple object, here I wanted to discuss some of the ways they can be used and, since v2019.2 my absolute most favouritest (I know, I made that up) function: the Change Parameter action.
Viewpoint: Parameters
The most easiest function to define, yet being a Tableau function, they have such a tiny data footprint it is almost laughable
In case you haven't read some of my other articles, lets just be clear on what Tableau is, is not, and what it is really doing:
About Tableau
Tableau is a data visualisation platform.
Tableau does not store nor generate data, and beyond the scope of table calculations see here for more information, Tableau doesn't perform any calculations either
What Tableau does do is to convert all data activity into an SQL query to send to your data source, the source engine will execute the query, performing those (sometimes terribly complex) calculations, and send the result back to Tableau in the form of a table. Tableau will then read this table and literally paint-by-numbers to build your view.
In short everything you do will be converted into a query for your data server to execute, and whilst this isn't always a problem - there are even some who feel it is entirely proper for the server to perform the heavy lifting; sure, this isn't too much agro, but not on a production environment a hundred times per day: heavy lift work should be performed when it is the greatest benefit with the least impact - overnight, when the server is not in use.
Anyway, I digress.
So whilst it is fine for the server to undertake a reasonable amount of heavy-lift work, there are things we developers can do to reduce the impact largely by using built-in objects such as parameters, groups, sets, aliases, text boxes and bins
Anything else?
Parameters are great for performance, and being a Tableau object, they are not necessarily populated direct from the data unlike quickfilters; historically, this was always a problem as in order to keep the parameter values updated, a developer would need to manually update the list every so often, which meant they were often pushed back somewhat, as they weren't as dynamic.
And then there's the fact that they are still single-select when using a list, unlike the multi-select functionality of quickfilters
Sadly, these were part of the reason why their power is often overlooked, especially following the v2019.2 game-changing functionality Tableau (Software) added to Tableau which has meant that at the very least, sole reliance on the very poor performing quickfilters can now be largely avoided.
A brief note about quickfilters
You may have been advised to limit the numbers of quickfilters on a dashboard in order to preserve performance.
This is because Tableau must perform a Select Distinct against each of the fields used to build the quickfilter. So, if your table has 100M rows (not uncommon btw) but the field is un-indexed, then the data engine must read every row in the field and group each entry in order to generate a unique list ready to send back to Tableau for Tableau to create the quickfilter list.
Now imagine your list identifying 50 unique items from a table 100M rows long, that's a lot of looping operations. Now imagine how much more processing power and memory will be needed to run this 5 more times for a dashboard with a modest 6 quickfilters!
The game-changing update I made reference to earlier: Change Parameter action. For the v2019.2 release, Tableau (Software) introduced a new type of action that once configured:
|
|
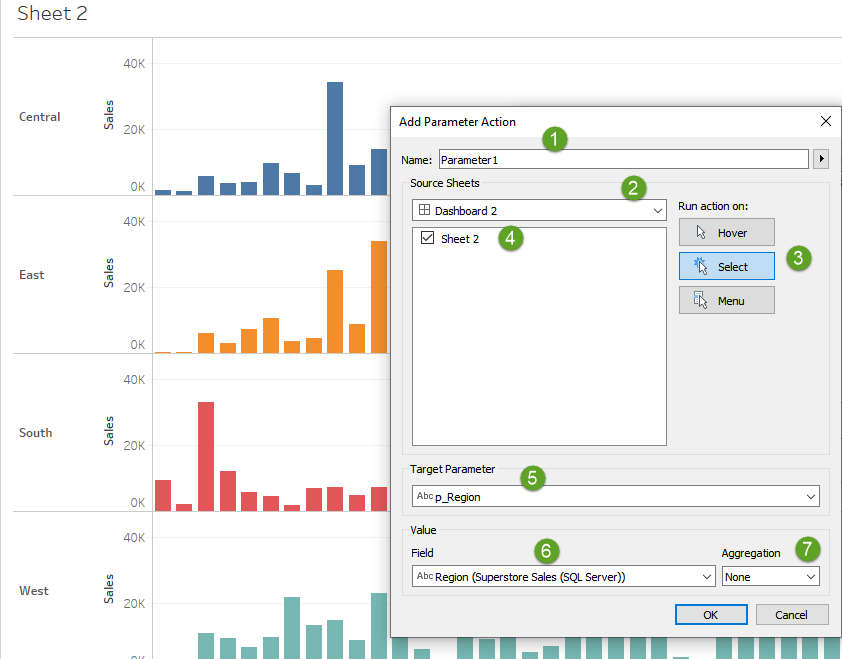
You are now able to populate a parameter from a chart or table selection, to use wherever and however you wish; which is exactly how the two charts in the expansive section above work; and with the parameter able to recognise multiple selections by automatically inserting an ' or ' between each selected item, then the parameter does become multi-select, though you do need to be wary of how to materialise these outputs to your use.