So, what is Tableau?
The tool we use to visualise stuff init!
...
(I'm sure users of other software will add to this list)
So why do we need to know this?
Well, before we can begin to understand what Tableau is doing, we need to understand what Tableau is doing.
...
It's funny you should say that because I felt the best opener to this piece was to demonstrate that which most of us analysts and devs often face.
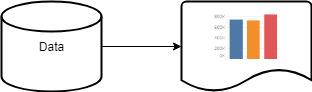
High-Level flow of many Visualisation Tools:
So you've had your rant, now what?
Back to my question: What does Tableau do more precisely, how does Tableau do it? And, why does this matter?
This matters for a couple of reasons, mainly for the consideration of optimisation but also, so we as analysts and developers can produce better reports, because anyone can create a chart, and with the relative ease of Tableau, Excel and Looker (and others), anyone can begin to put together a dashboard; but, not everyone from the off has the Best Practice knowledge to be able to weigh-up what looks great like an info-chart, and what is necessary without harming the source.
Yes, you read that right: Harming the source -
New users and end-users alike conclude that everything they see is taking place inside of Tableau, that when a calculation is written and applied, that this calculation is being evaluated by Tableau when in actual fact, very few calculations are evaluated by Tableau (this is mostly limited to table calculations as these are processed against the materialised data):
...
The source (database engine / Microsoft Jet) will execute this and return just the result back to Tableau. From here, Tableau simply plots the output in accordance with your mark-up:
Tableau Process Flow:
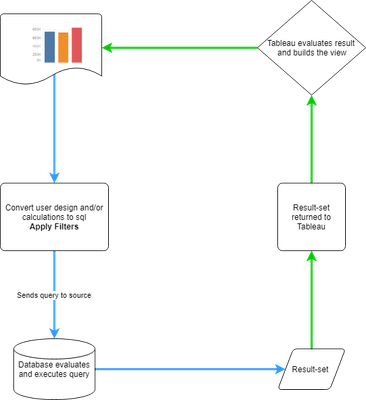
So now we can see what it is that Tableau is doing - at least from a high-level, we can begin to use this information:
- To investigate problems as they arise
- Identify the most likely areas for poor performance
- Work-out the best charts, dashboards, stories for the job in hand
- Consider the performance impacts of the dashboards
- Design appropriate optimisations such as indexes, to properly support our work
- Design dashboards that make best use of the built-in objects to avoid unnecessary querying
- Design reports that can include better data quality reporting
Tableau Early Strap-line:
Answer questions as you think them
...
Which brings me full circle:
More often than not, slowness in a report is often blamed exclusively on Tableau when the real culprit is usually poor dashboard design coupled with poorly-optimised or un-optimised data sources.
I hope this quick dip under the hood has helped clarify how Tableau works and where data problems and/or performance issues can arise.
...