...
Contrary to popular belief, and much to the dismay of big-data developers, OLAP - the high(er)-speed data data block of old, far from refuses to die, but instead, appears to be growing in strength.
From a period where data-space was a premium, data processing was costly and analytical skill was scarce OLAP (Online Analytical Processing) was born, devised and thus defined as pre-aggregated chunks allowing users to simply drag-and-drop these pre-aggregated pieces into a pivot-table in order to very quickly analyse huge amounts of data (in the millions - I know, not so huge any more), and then, to enhance the output with charts, this was seen at the start of the early 2000's as the ultimate in performance solutions; looking at the basics of the architecture, you could be forgiven for noticing that Tableau behave's behaves in a very similar way.
But, as space is no longer such a premium, skills lie in abundance and most smartphones are built with more space and power than servers of old (even if they only use this hardware for facebook Facebook and playing snake), still, OLAP refuses to be dropped quietly and, whats what's more, as big data has really taken-off, OLAP is seeing a sort of revival as teams seek to compress massive data-sets into more user-friendly outputs for Microsoft Excel and to a lessor degree, OpenOffice Calc and/or GoogleSheetsGoogle Sheets, it is becoming ever clear that OLAP means to stay. Which can present a problem when cubes are seen as the single-version-of-the-truth, and reports are cube-centric.
...
Short of learning and thus writing MDX or, using CustomSQL with OpenQuery to pre-flatten the source (discussed here), this can be very problematic.
Resolution:
However, unlike many of Tableau's competitors, there us a fairly simple way around this problem but,
Instructions
...
this can be process heavy, and you need to be very aware of the ordinal positions of your data as it appears in your view, and crucially, all amendments and enhancements to charts are definitely best done as a table before re-drawing as a chart.
Consider this image: assume for this example that we are looking at a cube output
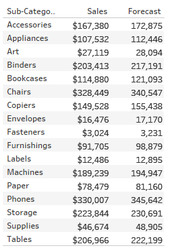
Let's imagine for a moment that you want to calculate the percentage difference between Sales and Forecast for Binders. Keep in mind that more often than not, measures are also partitioned by a dimension (Sales, Profit, Forecast), so it is often the case that you will be unable to refer to the measure-name too.
This is easy, we can perhaps write a calculation similar to this:
| Code Block | ||||
|---|---|---|---|---|
| ||||
(
    (If Min([Sub-Category]) =  'Binders' Then Sum(Sales) Else Null End)
    -
    (If Min([Sub-Category]) =  'Binders' Then Sum(Forecast) Else Null End)
)
/
(If Min([Sub-Category]) = 'Binders' Then Sum(Forecast) Else Null End) |
Great, this would work,, in a relation world, but this is OLAP, we are unable to slice the dimension data here, with Tableau returning an unknown error for the split.
Therefore, really, this calculation would become:
| Code Block | ||
|---|---|---|
| ||
(
    Sum(Sales)
    -
    Sum(Forecast)
)
/
Sum(Forecast) |
Which isn't what is required as this would provide an output for all the fields.
Table Calculations to the rescue
Yes, table calculations are your friends here as these use ordinal positions to provide the output:
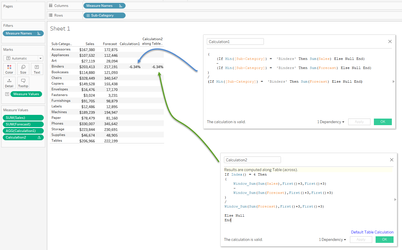
Being more complex, positional table calculations do generate second-level calculations needed to be processed by Tableau so you will need to consider this when building your view.
Related articles
| Filter by label (Content by label) | ||||||||||||||||||
|---|---|---|---|---|---|---|---|---|---|---|---|---|---|---|---|---|---|---|
|
...
| Page Properties | ||
|---|---|---|
| ||
|