Skip to end of metadata
Go to start of metadata

You are viewing an old version of this page. View the current version.

Compare with Current View Page History

« Previous Version 10 Next »


Tableau has seen an exponential rise in use over the last years particularly by Excel users. Much of the training material available, indeed, even this very site, is geared to helping you get the most from Tableau, however, many of these fail to help users with the most basic of asks, to settle and convert Excel users into the world of Business Intelligence.

 This article seeks to address some of the most common problems faced by Excel users, hopefully, to help you realise your potential as a BI developer.

Whilst this article is Tableau-centric, being a BI tool, this article is also useful for Excel users moving to a competitor BI tool such as QlikSense, Business Objects, Looker etc


What is Tableau?

Come to think of it, what is Excel as well?

 The first question that no-one thinks to ask:

Knowing this, I hope to help you settle much quicker than without it.

Excel is a spreadsheet tool. So really, this isn't so much a question of what Excel is but rather, a question of what a spreadsheet is, and how does this compare to Tableau.

So, a spreadsheet is:

a computer program that allows easy entry and manipulation of figures, equations, and text, used esp for financial planning and budgeting - Collins English Dictionary (March 2019)

And how does this compare to Tableau?

Tableau is not a spreadsheet, it is a presentation layer. Or rather, a pivoting-tool

This is the key answer and the one that should always remain on your mind when you are working with either tool: Tableau is a presentation layer which means, it is the final step in any data-work whether this be:

  • An analysis
  • A data-driven dashboard
  • An investigation
  • An info-chart etc

Where you would use a spreadsheet to enter data, and manipulate data and then analyse data, Tableau simply visualises data and the output of calculations. This means that any alterations to the data through calculation, editing and manipulation are either semi-permanent, or permanent and this able to be used by other tools, whereas the data that Tableau display's has only been read by Tableau, it's state has not altered.

This brings us neatly onto the next section: Where do calculations take place.

What processes the calculations?

 Great question which allows us to take a peak at the architecture:

Spreadsheets (Excel, OpenOffice Calc, Google Sheets etc) contain all the necessary programming to evaluate and execute the expressions you enter be it arithmetic, logic, string, date, manipulation, or a combination of any of these.

Tableau has only a rudimentary calculation function for Table Calculations, which are largely intersect and lookup calculations; other than these, all other calculations are sent as snippets of SQL code to the data-engine of the data-source (such as Excel or SQL Server) for execution. Once executed, the source-engine returns the result-set back to Tableau for Tableau to consume and plot as a visual representation.

To avoid confusion, I best explain the Hyper extract here. So you may have come across a method of snap-shotting data in the form of an extract, by instructing Tableau to extract a portion or all of the data from the data-source; this is then saved as a .hyper archive file (.tde for pre v10.5).

Although the data has been extracted by Tableau, and exists in the same archive as the Tableau workbook, Hyper (and tde) are processed by different modules than those used for the workbook; expanded into a temporary memory-space as a column-store NOSQL database, expressions formed by the visualisation layer are still sent outside the workbook to the data-processing layer regardless as to whether this is to a JET evaluation (Microsoft Joint Engine Technology for processing csv, text, spreadsheet and MS Access data), SQL/NOSQL database or Tableau Hyper/tde

Can Tableau write data?

 A classic question:

Excel users are used to being able to enter data into cells - short of connecting to a database or OLAP cube, or importing data from an alternate source, this is the only other way (and tends to be the primary method), of getting data into Excel, furthermore, once the data has been written into Excel, it can be made available for other workbooks to read from almost as a writeable database.

Natively, being a presentation layer, no, Tableau can only read from a data-source:

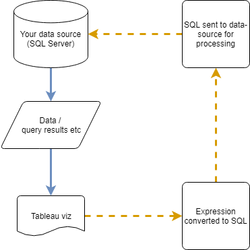
However, with a little programming skill, access to an EYL tool such Microsoft SQL Server Integration Services (SSIS) or Jenkins etc, it is possible to capture the data from a chart or table and write it to either the existing source or to a new source.

And, from June 2018, with the release of Tableau v2018.2 which now allows the use of 3rd-party plugins operating from Tableau Server, there now exists a plugin that will provide on-click extraction for you to manually write-out to a file or data-source of your choice.

Just remember, Tableau cannot natively write data, neither should it be able to so any method that allows for the capture of data is currently unsupported.

There appears to be loads of things I can easily do with Excel but not or not very easily with Tableau

 Tableau is a BI tool...
So you keep saying, but this still doesn't help me to understand why Tableau cannot do seemingly simple tasks

As mentioned above, spreadsheets are self-contained programs that have all the necessary functions needed to allow them to calculate the expressions that you enter into the cells the result is, you can do a lot more with Excel in this way than you can with Tableau.

Tableau is a presentation layer - a very pretty presentation layer but nothing more. The easiest way to understand Tableau is to think of it as a pivot-table and pivot-chart. When using either of these in Excel, you define a source typically several rows and columns of data, you then drag the defined elements into place as a table and then, if you need to, place a chart atop the pivoted data.

Tableau is no different as such, Tableau is largely restricted by two items (which are largely the same two items that block full creativity in Excel):

  • What can the data source do
  • How to work with the result-set of the pivoted data as behind the scenes, Tableau generates the data as a table and then places your charts atop this.


So if Tableau is nothing more than a Pivot Table and I can already use this in Excel, why do I need Tableau?

 You don't necessarily need to use Tableau...

.. if your data is already in Excel, and you are comfortable with the pivot-table functions there however, with Tableau you can:

  • Analyse the data in situ with no further transformations required beyond expressions
  • Control outputs from one-to-many charts
  • Provide interactivity to cut some charts but not others without modifying the source data (illustrated here as the Raw Pivot Table
  • Use functions beyond their designed scope to add further information to your chart
  • Access pre-built analytical functions to add further dimensions to your data
  • Reduce raw processing power as much of these will be handles by the source


All of which is perfectly accomplish-able with the Excel Pivot-Table however, to do so with Excel, you must first define your pivot table, then use this pivot table as the basis for new pivot-tables that will provide your analyses and then build against the new tables eg: 


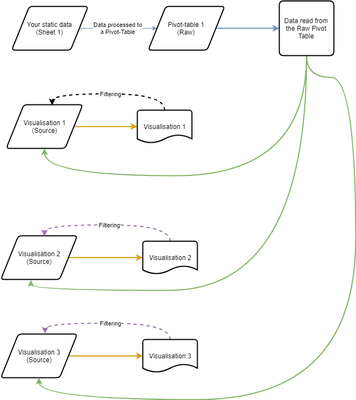
So as you can see, it can be done although the question becomes one of ease of use, ease to maintain and, data availability, where Tableau is unrestricted on the numbers of rows it can read (restricted only on the spool size and pipeline width from the source).

If however this is a question of whether Tableau is right for you when you have no Tableau expertise, are very proficient with Excel, have sharepoint installed and configured and, are proficient using PowerBI, then this becomes a question of do you want to move from one BI tool to another very similar yet slightly more mature product?

So, if I can do more with Tableau than I can with Excel, can't I just ditch Excel?

 Are you mad?

No, you cannot.

Excel (spreadsheet tools) are more than just a means of presenting data, they are data storage, data manipulation, and data calculation tools; they are your first port of call for most things data and as your visualisation career progresses, will be where you can quickly test idea's on small sets of data to ensure correct functionality before moving the calculations to Tableau.

In short, Tableau should be working with Excel, and never be a replacement for it. 

Tableau is NEVER wrong

That's a bold statement, I hope you have some rock-solid evidence to back this up.
 I do - you see, Tableau is a presentation layer...
Stop with this presentation layer nonsense, you're like a broken record!

That I may be, but this is such an important point to get across.

Tableau's only function is to visualise data. Tableau does not

  • Generate data
  • Modify data
  • Calculate output's etc

As mentioned previously, you write expressions which are then fed out to an alternate engine, it is this engine that calculates and then returns the result to Tableau to plot.

Your expressions can be wrong, however, once you have verified your calculations and the resultant numbers (a spreadsheet will help you here), then the numbers can never be wrong.

The data can be wrong though.

Which is where we can use Tableau for Data Quality.

One of the major problems developers will face is user's who complain that there is a problem with Tableau.

The problem is never with Tableau but, we as developers have the unique placement in investigating the data-failure and either fixing ourselves, or instructing the BI team on how to resolve


  • No labels