Personal Portfolio
A selection of previous work both commercial and personal:
Click the images to open/interact and download
Commercial:
Global Telecommunications Company
Designed: September 2018
In production: October 2018 - Present
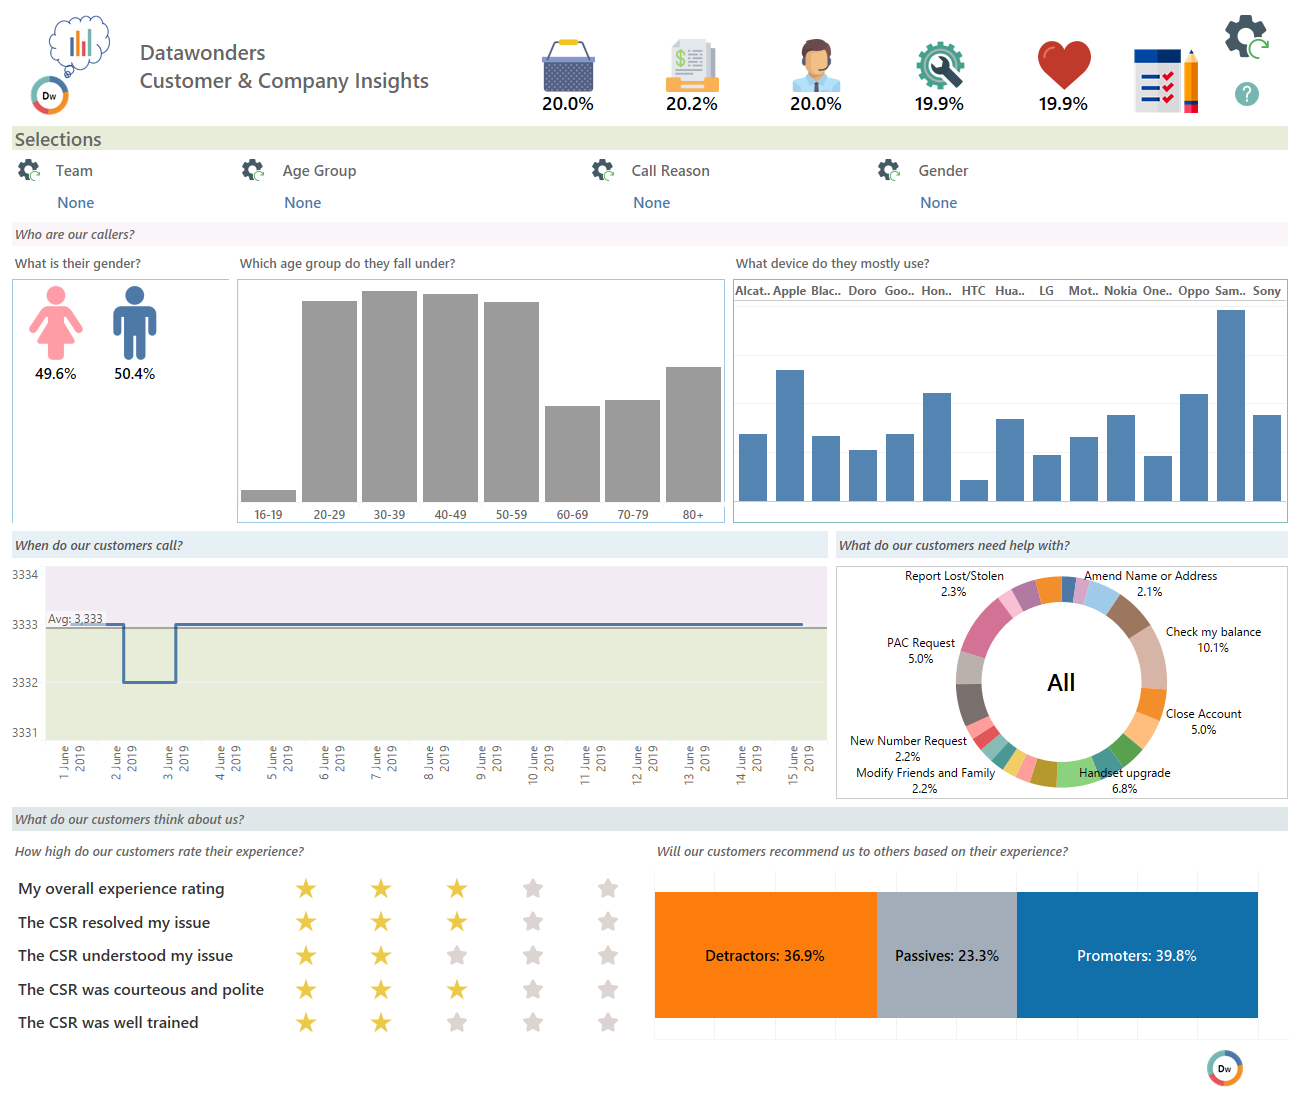
Purpose: A global telecoms provider raised a tender for a Tableau developer to design and develop a customer insights dashboard.
To demonstrate my abilities, I designed this complete with 100,000 rows of sample data. They loved it and requested I re-build for their data instead, albeit, with some additions and adjusting the background to the company colours, allowing for the design to be easily transferred to a PowerPoint deck.
This version has been updated to make use of the 2019 parameter actions, allowing me to switch to smaller more focussed sets using parameter filtering instead of action filters against a much larger set.
Furthermore, when connected to a database and using CustomSQL, these parameters can now fully drive the sql ensuring the amount of data travelling over the pipeline is kept to a minimum which is especially useful when using a mobile.
Some of the methods & functions used include:
- Parameter actions
- Densification (for the feedback stars)
- Densified grid (both x & y axis are formed from densification)
- Modify Sets
- Set brushing
- Charts in tooltips
Expedia: Company-wide Performance Management Report
Designed: May 2016
In production: October 2016 - Present
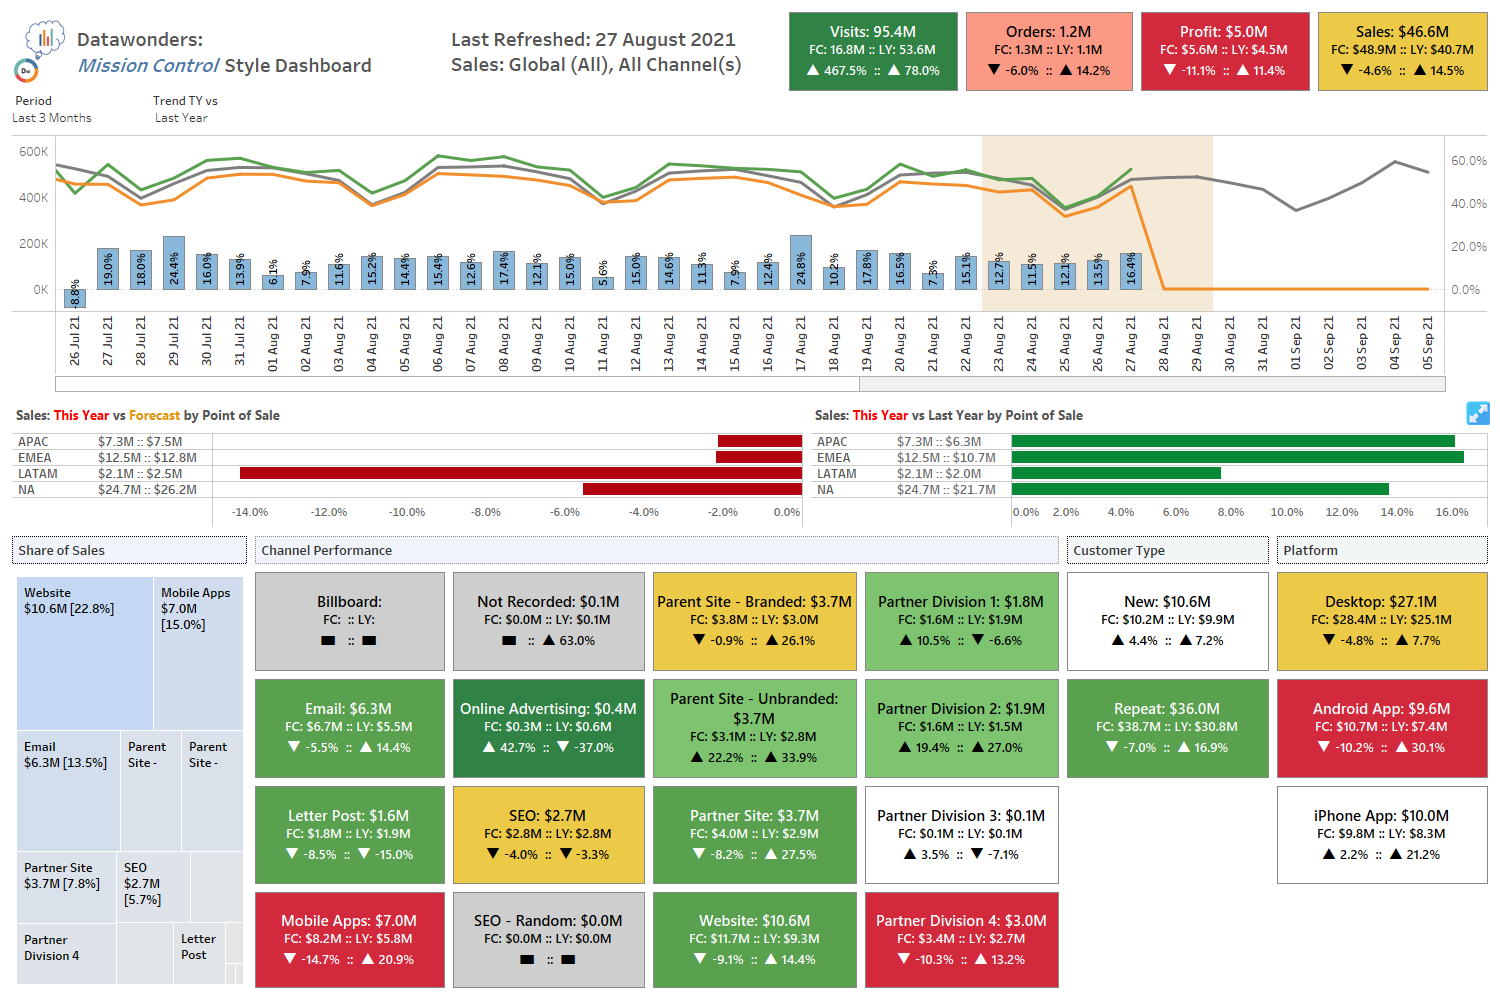
Purpose: Designed to provide very high-grain to very low-grain analysis of overall performance of the entirety of Expedia Inc metrics; a screen-print is pulled each day and emailed to the each subscriber of the dashboard.
The major consumers include the leadership team (Company President, Divisional directors, Senior Directors), with finance, marketing and regional sales teams.
Demonstrated here using a greatly inflated version of Tableau's Superstore Sales
Case Study: Statistical mock-up for Vrbo
Designed: June 2019
Purpose:
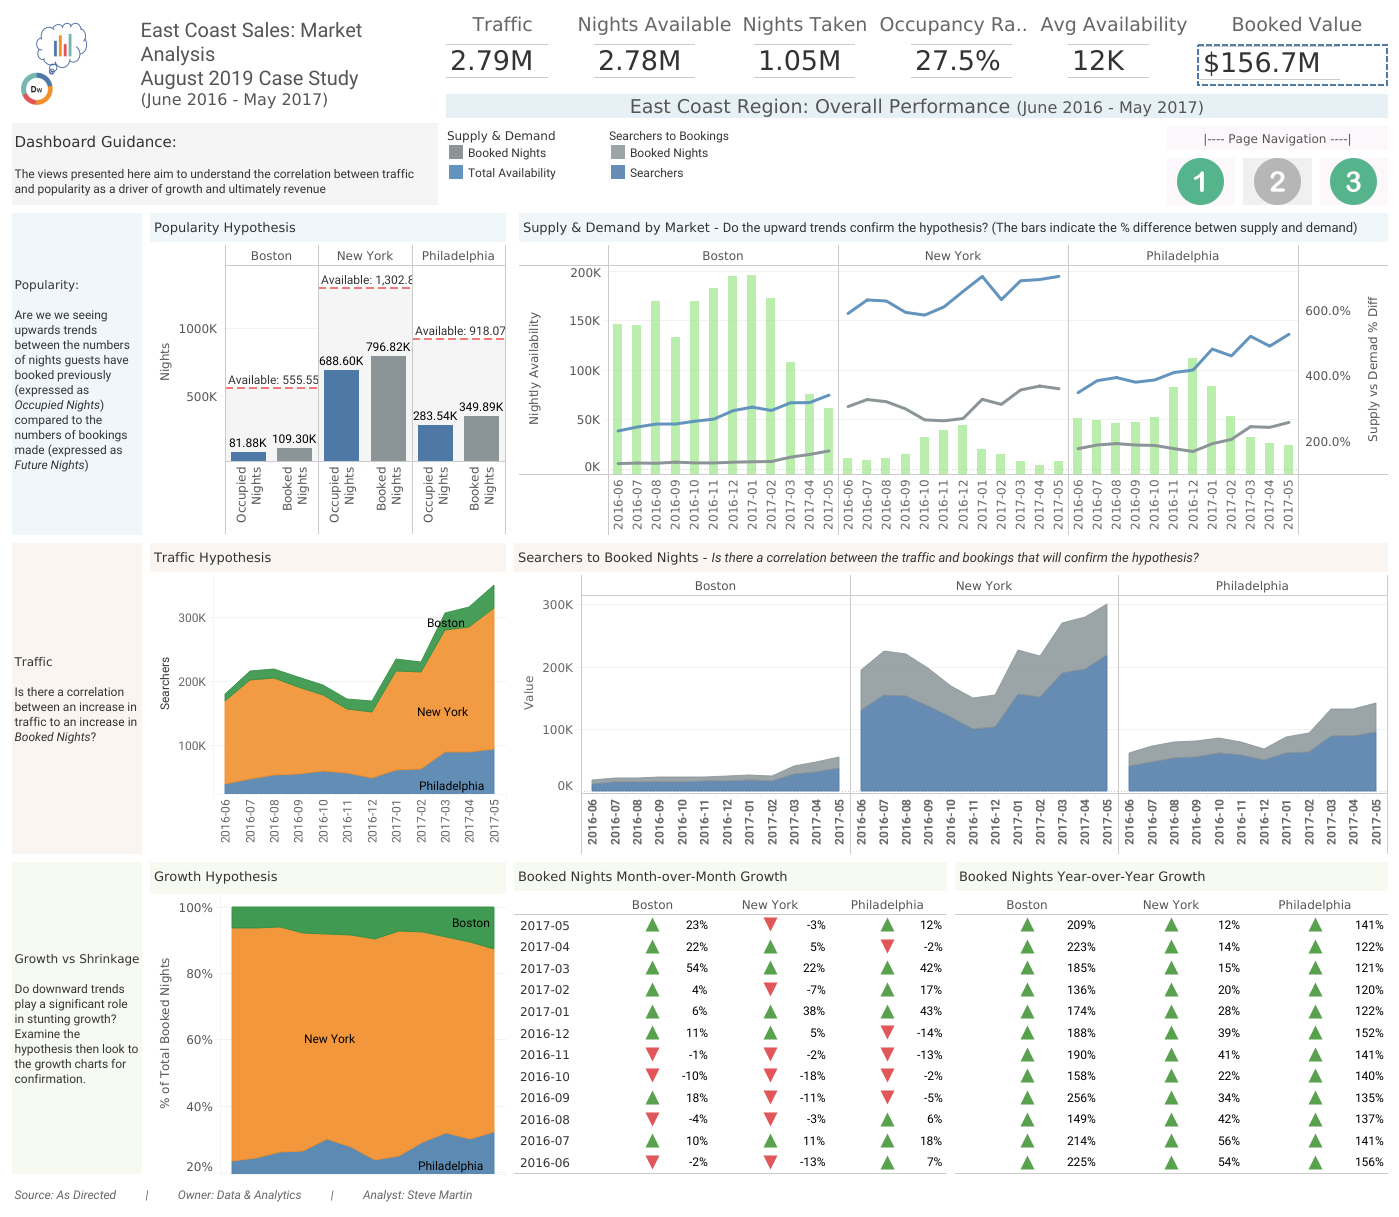
I was approached to demonstrate the power of clean-line visualisation when compared to standard working charts, in identifying small but significant bookings to a city destination previously considered to be of less value, when compared to much larger players in the company's portfolio.
Whilst the data in the situation was falsified for the demonstration, the ideas and techniques used allowed the client to consider such practices for their future works.
Where to Eat: DXC Consuling Christmas Dinner 2018
Designed: December 2018
Purpose:
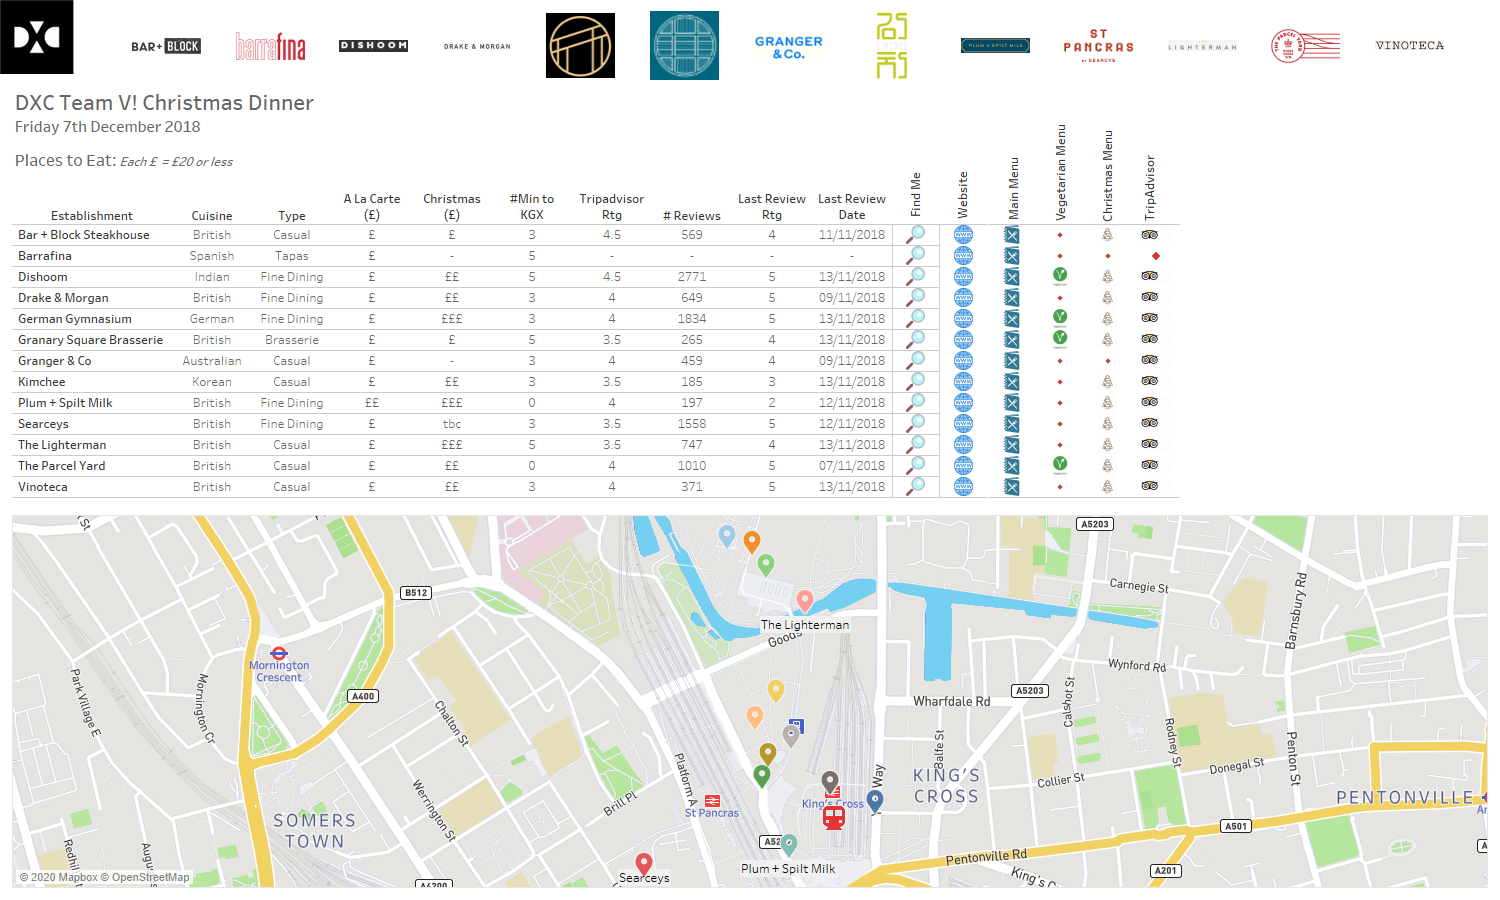
With Christmas in mind, yet reusable at any time of the year, the design brief was simple, put something together in Excel for a list of restaurants in close proximity to London Kings Cross Station to a range flavours, that could accomodate different dietary requirements, to a maximum budget of £30 per person.
Well, I was hired as a Tableau Consultant for other works, so to use Excel would be an insult. Yes, the dashboard is a little basic, in truth it took around 10 minutes to build the dashboard and 2 hours to gather the data (including the lat/long co-ordinates). But it worked, a location was found and the dashboard is still doing rounds to this day.
Personal:
UK Land Registry Price-Paid Data
Designed: November 2014
Purpose:
Real-property is often cited as giving a good idea as to the economic state of the country. As I have a personal interest in property analytics, I set-out to build a series of dashboards to test this theory.
The current dashboard is version 1, however, with the addition of further public sets such as crime (in development), commerce, employment and health; once completed, we should be able to provide a more telling picture.
![]()
Periodic Table of Elements
Works best of you close the side-bar