...
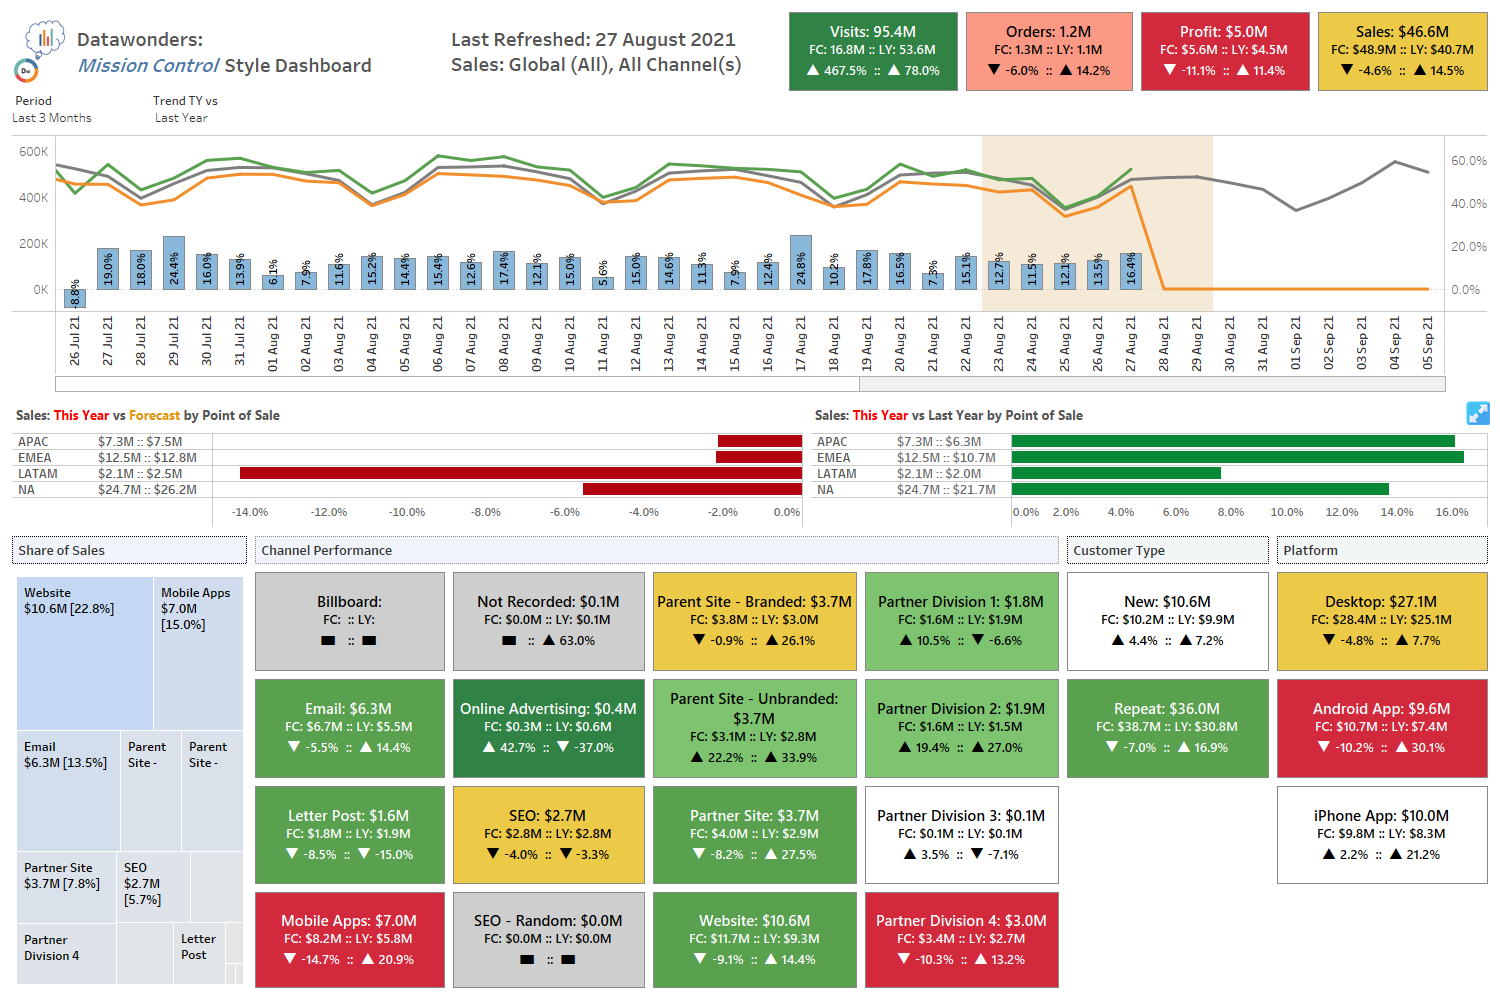
Purpose: A global telecoms provider raised a tender for a Tableau developer to design and develop a customer insights dashboard.
To demostrate demonstrate my abilities, I designed this complete with 100,000 rows of sample data. They loved it and requested I re-build for their data instead, albeit, with some additions and adjusting the background to the company colours, allowing for the design to be easily transferred to a PowerPoint deck.
...
Purpose: Designed to provide very high-grain to very low-grain analysis of overall performance of the entirety of Hotels.com Expedia Inc metrics; a screen-print is pulled each day and emailed to the each subscriber of the dashboard.
The major consumers include the leadership team (Company President, Divisional directors, Senior Directors), with finance, marketing and regional sales teams.
| Note |
|---|
This Superstore Sales demonstration piece differs slightly in performance compared to the production piece due to the year-over-year in the demo being calculated using a Lookup, which thus requires further table calculations to filter, rather than the production piece using a pre-defined Prior-Year calculation, defined in the etl. |
...
Demonstrated here using a greatly inflated version of Tableau's Superstore Sales |
Case Study: Statistical mock-up for Vrbo
...
| Tip |
|---|
Works best of you close the side-bar |
| Iframe | ||||||
|---|---|---|---|---|---|---|
|