...
Remember when we used to want to know how a single measure breaks-down across the attributes of a dimension?
| Tip |
|---|
Click the image to open/interact and download |
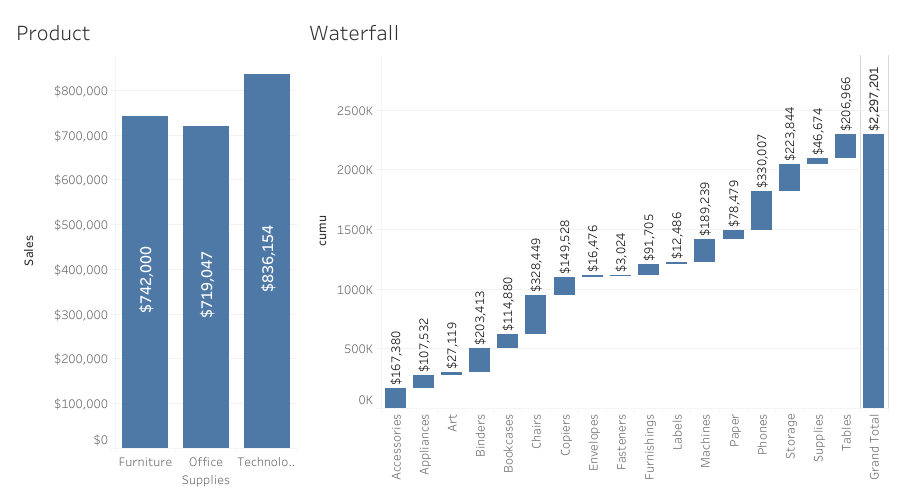
Building this is as simple as creating a Gantt chart and simply reversing the value of the measures:
- Drag Sub-Category to Columns
Create a cumulative calculation: Running_Sum(Sum(Sales)) Drag this to Rows
- Switch the chart type to Gantt from the Marks Card
- Create a negative calculation: -Sum(Sales) and drag this to the Size on the marks card
- Add the totals: Analysis > Totals > Show Row Grand Totals
Hop over to the Walkthrough: Building the Most Requested ChartsShow me how to build that page - video 17 to see this.
...
| Note |
|---|
Before reading further, please ensure you have read my article on densification About Densification (12 Min) Lets Talk: Densification (to ensure you are using the most efficient method), even if you are already comfortable with the concept. |
...