Lets Talk: Table Calculations
I'm quite new to Tableau, I've heard of level-of-detail expressions and seen them bandied about the forum's quite a bit,
but I'm not sure I've ever seen or heard of table calculations neither do I know what they do or how I would use them.
Ah, Table Calculations, you may have seen them, but were not sure of them, or even aware that they had a name.
Table calcs can be mostly thought of as aggregated-scoped-referential calculations, similar in operation to SQL advanced analytical functions or using a combination of lookup, index with match or offset with Excel.
A Quick and Simple Guide to Advanced Calculations
SQL Advanced Analytical Functions
For SQL, advanced functions always need a scope to be defined, given in the partition by clause of the function:
Sum(Sales) Over(Partition By Sales_Region Order By Sales_Region asc) As Sales_by_region
The above calculation will order the data by Sales_Region before aggregating over this. The benefit to using a this type of calculation allows for aggregations in the projection without needing to group the data using a group by for example:
Select
c.Customer
,c.Customer_Address
,s.Sales_Region
,Sum(s.Sales) Over(Partition By Sales_Region Order by Sales_Region) As Sales_by_region

From Customer c Join Sales s On c.Customer_I = s.Customer_ID
In the case of an aggregate function (Sum, Count, Max, Min, Average), this is identical to an Excel SumIf function or, SumIfs when multiple scope levels are used.
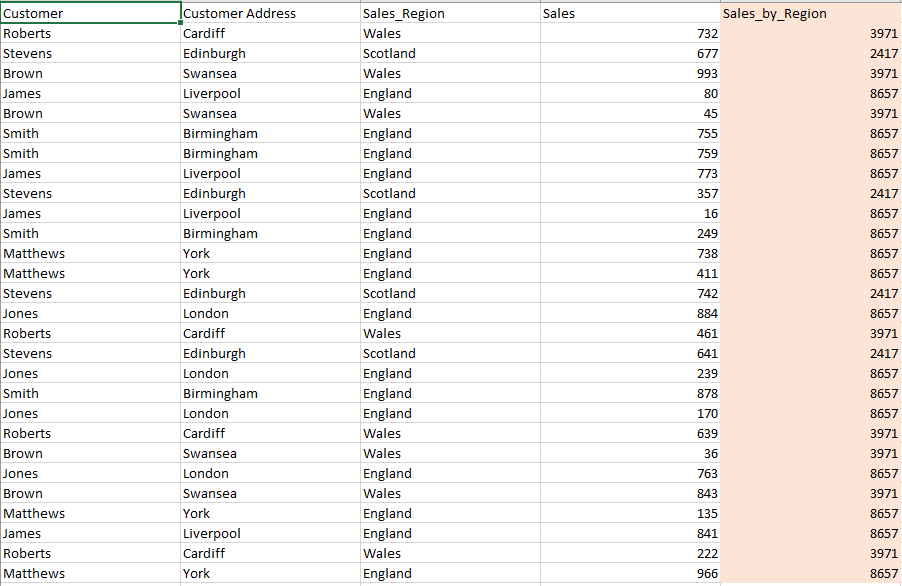
All 28 rows are present in the complete set with the regional values applied to each row.
This is functionally different from grouping as all non-aggregate values in the set will be included in the group by;
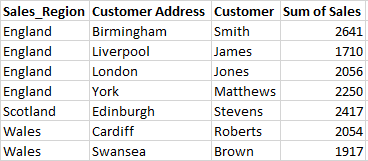
Where the data has been aggregated.
What will happen here is the aggregated value for each region will be added to each of the set without aggregating the complete set and thus losing set granularity, so where you have a set of 100,000 rows broken-out across 5 customers per region and then 4 sales regions, all 100,000 rows would be returned with the aggregated Sales_by region applied to each row
List of Table Calculations
| Category | Name | Expression |
|---|---|---|
Sequential Row Numbering | First | First() |
Index | Index() | |
Last | Last() | |
Rank | Rank(Sum(Sales),'asc') | |
| Reference | Lookup | Lookup(Sum(Sales),1) |
Size | Size() | |
| Window Functions | Running_Sum | Running_Sum(Sum(Sales)) |
Previous_Value | Sum(Sales) + Previous_Value(0) | |
Total | Total(Sum(Sales)) | |
Window_<Agg> | Window_Sum(Sum(Sales), First(),First()+1) |
Of Table Calculations
So now we know a little more about table calculations, typically where are they used and more importantly, how do they differ from normal and level-of-detail calculations?
Lets tackle this in stages:
How do Table Calculations Differ from the other Calculations
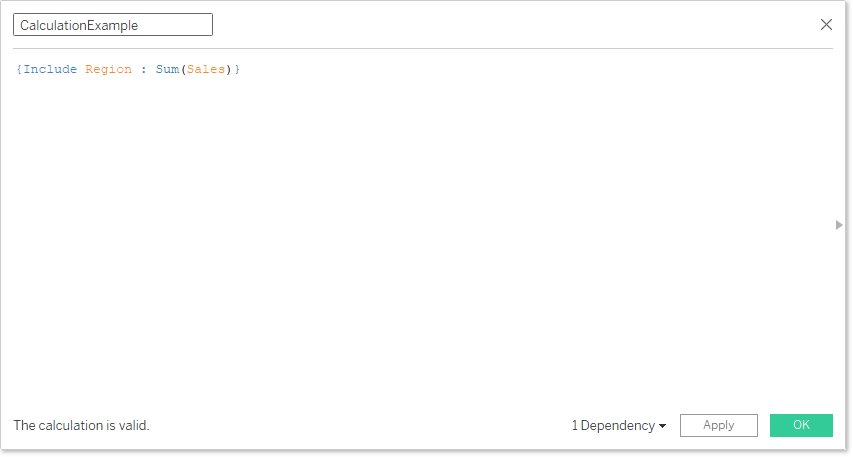
Well it is simple really, with exception of the First(), Index(), Last() and Size() calculations, all table calcs are aggregate which means the value they are working with, first needs to be aggregated such as Sum(Sales), Count(Product) or {Include [Region] : Sum(Sales)} and secondly, these calculations take place inside Tableau, directly on the data that is visible (including scrolling) to you.
As a result, table calcs are used in connection with normal and LOD calcs rather than in place of them.
So How do Table Calculations Actually Work?
As data is returned to Tableau and materialised (by you) into the working window, table calculations are generated at this time, which means that table calculations are dependant on the filters that have been applied to your view.
Once you materialise your data, Tableau is simply running your selected calculation against teh defined scope but crucially, only against the data in your working window, all other data that is not materialised into the view will bear no relevance on the output of the expression used, even if you have defined the scope at the expression-level in the expressions editor.
And Finally, How and Where Will I Use Them?
How breaks down to two important criteria:
- Type of calculation / purpose
- Scope
Calculation Type
Is down to what you are trying to achieve, with row numbering calculations simply written as FunctionName() so the Index function for example is written simply as Index()
Whereas the remaining calculations (see the table above) all enclose an aggregate calculation on number in some form for example the running_sum() calculation for Sales would be Running_Sum(Sum(Sales)).
Scope
Arguably the most important part about table calculations is that of scope.
The scope of a calculation arguably detracts from the simplicity of Tableau, as no other function within the software requires you to consider beyond the drag-and-drop interface, exactly how Tableau needs to address the data.
Normally, when cutting data, it is enough to use case and/or if statements to determine which data is including in the calculation or, in the case of LOD calcs, what additional fields need to be considered (or removed); this is still true of table calculations as those calcs are wrapped inside table calcs, however, when you are writing your table calculation, you will be presented with the "Default Table Calculation" indicator:
| Normal Calculation | Table Calculation |
|---|---|
|
|
|
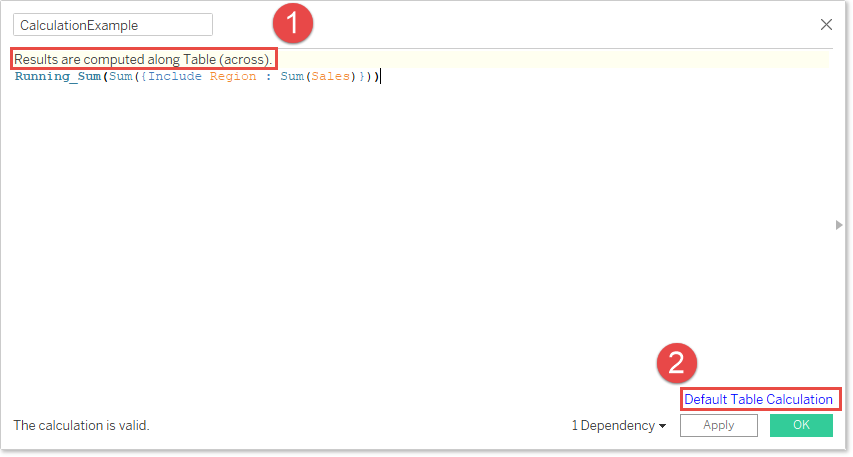
Upon first creating your calculation, Tableau will default the table calc to Table (across) - do not worry if you have no data running across your table, i this instance, Tableau will switch to Table (down) in this instance.
Applying the scope from the calculation editor
Be careful when setting the scope from the calculation editor:
Defining the scope in the calculation editor affects the scope for all table calculations that form the calculation:
Looking at this table:
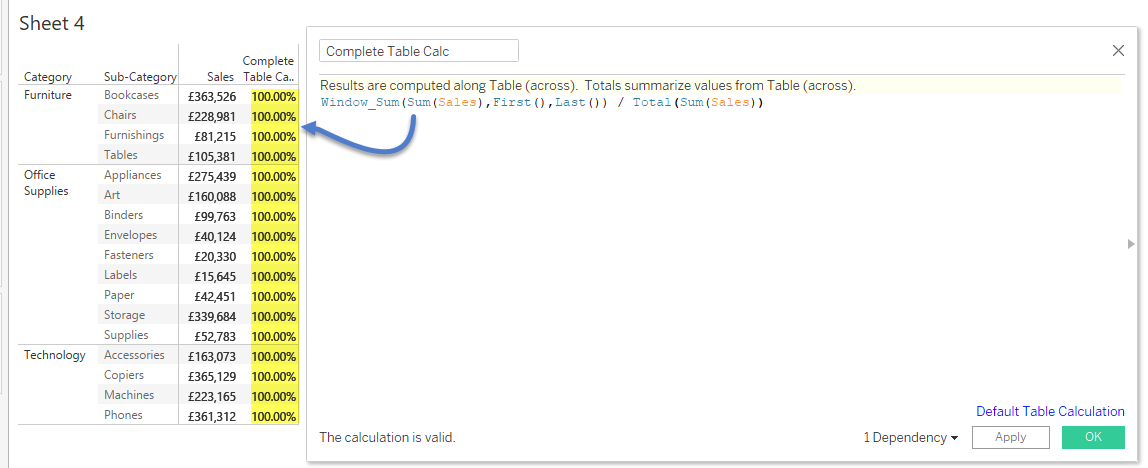
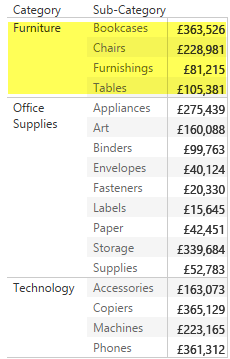 Assume you want to compare the total for furniture against the overall total: 779,103 / 2,938,103, using this calculation:
Window_Sum(Sum(Sales),First(),Last()) / Total(Sum(Sales)
Will mean the scope is set for the whole calculation, so regardless as to how you define your scope, you will always return 100%
But, by breaking down the calculation into two separate calcs and then using a third calc to perform the calculation, means that whilst Tableau will not provide the ability to set the scope from the third calculation window, you can set the scope from editor for each calculation and, more importantly, when applying the value to the chart:
 but by breaking the calcs down, we can see how we want to define the scope:
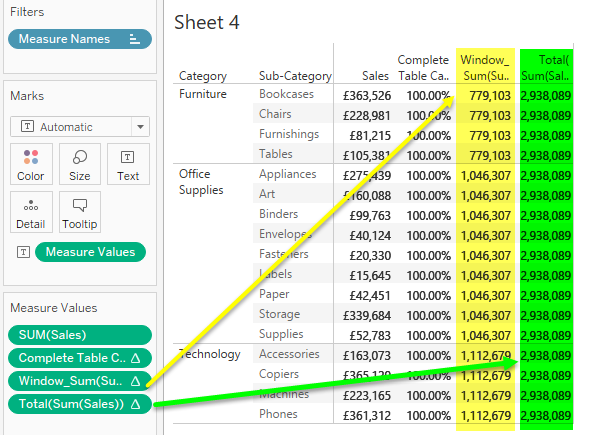 And so now we create the individual calculations, the combination calculation and then set the scope - note the delta symbol (
 ) on the pill indicates the calculation is a table calculation
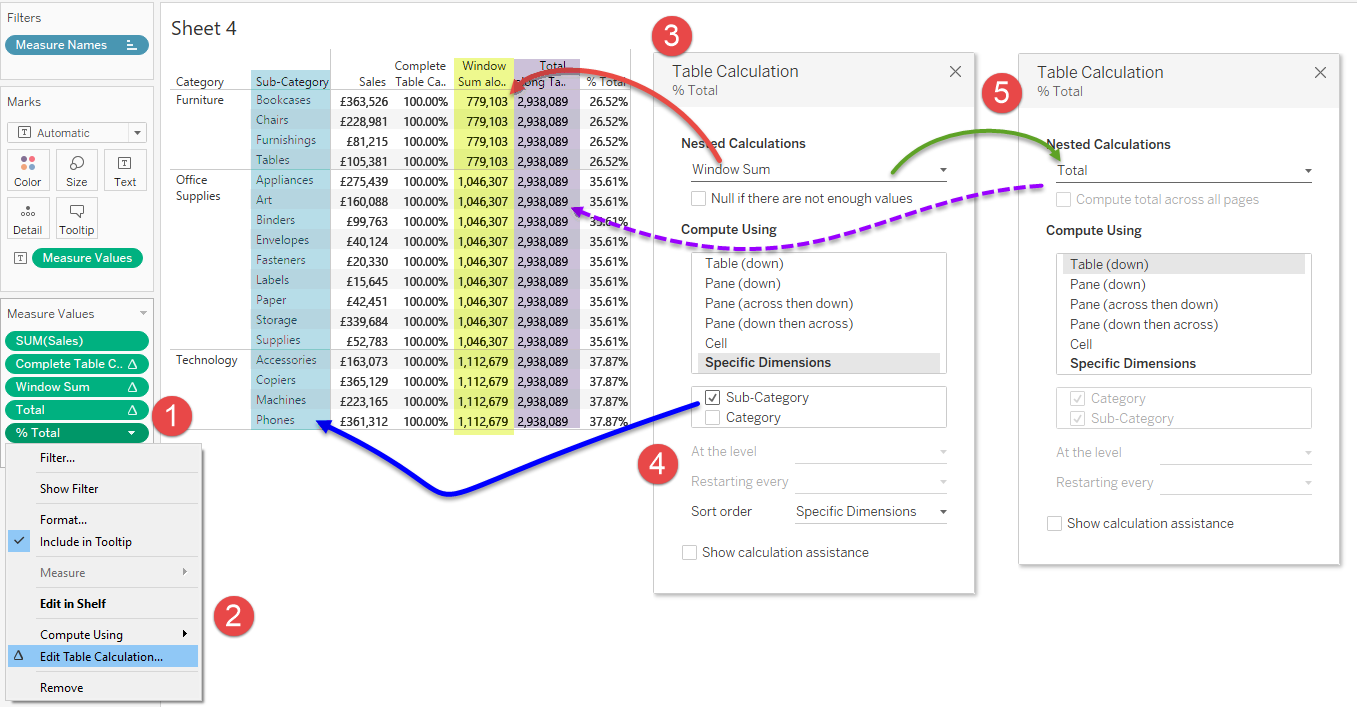
- Right-mouse select the pill that holds the complete calculation
- Select Edit Table Calculation
- Select your first nested calculation
- Adjust the scope of the first table calculation to Sub-Category - this tells Tableau that you are only interested in calculating the total for each Category
- Switch the Nested Calculations to the Total calculation and leave the scope at Table (down)
- Similar to defining the scope of LOD calcs, setting the scope from the calculation editor will permanently fix the calculation to the items. Whilst this is not as problematic as an LOD calc in that the scope can be adjusted on-the-fly for each viz, it will mean that the chart will break if the items are not present, but only until they are either added or the scope is adjusted
About: Use
So you have thoroughly explained how table calculations work, although I am still unsure as to when and where I shall use them?
Where you use them will be down to your requirements, however it is possible that you may have already used them such as:
| Lookup comparisons | Such as when testing for change in the case of A/B testing - variant vs control or, period over period eg: ( Sum(Sales) - Lookup(Sum(Sales),-1) ) / Lookup(Sum(Sales),-1) Will enable you to compare the current row to the previous row |
| % Total | You can easily use a level-of-detail calculation to calculate total: {Sum(Sales)} however, what if you want your total to be a sub-total? |
| Rank | The classic Top n. |
| Running_Sum | Without which, generating cumulatives would be impossible |
Many of the more complex charts require the table calculations for positioning in order hang data from them - the measure waterfall I built could not work without table calculations.
And performing calculations when using an OLAP source cannot be done without them (unless you use MDX which then only creates specific outputs):
OLAP sources (cubes), or any source of pre-aggregated data held within a rigid structure is often limited to simply retrieving data from an intersection of one-to-many members such that if-then-else logic calculations are usually unavailable, such the it then becomes necessary to use a lookup calculation to step in.