Lets Talk: Custom SQL
What is it?
Custom SQL is the SQL editor within the data model that allows you to write the query needed to produce the data for Tableau instead of using the Tableau drag-and-drop data model interface.
Ok, so why would I want to use it rather than the easier interface?
- Power, flexibility and control: Firstly, it places the output in your hands, to build just what you need using the power and flexibility of SQL which, when combined with the correct drivers, allows you to use the full potential of the SQL subset of your database
- Highly optimised queries: You can write, test and optimise the query needed to obtain the data, this is in contrast to the data-model where you can neither see nor alter / influence the query that Tableau generates
- Parameterised queries: Unique to Custom SQL, you can add further control elements to the query that operate ahead of filters to make changes from filters to query control in order to achieve greater flexibility
- Additive calculations: Increase overall performance by pre-materialising additive data in the result-set.
- Improved OLAP experience (SQL Server Only)
And now, the long-winded bit...
So lets look at these points in a little more detail:
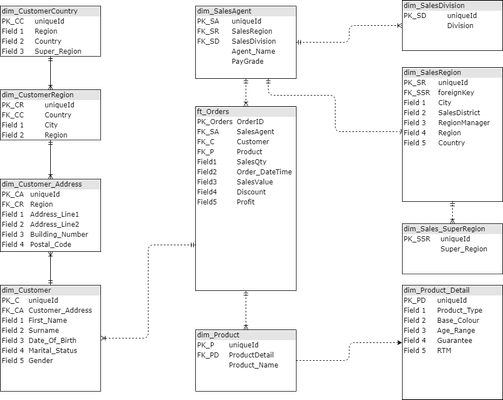
Power, flexibility and control: Take a look at this ER diagram:
Let's say you are building a dashboard that focuses on products (dim_Product) and Divisions (dim_SalesDivision). From the data-model, you would need to model:
- dim_Product
- ft_Orders
- dim_SalesAgent
- dim_SalesDivision
Yet you would only be interested in dim_Product and dim_SalesDivision; like an SQL statement, Tableau will also need to process all the joins before it can reach the data you require.
So, what is the benefit to me in writing SQL rather than using the data model, especially if both are processed at the same time?

As far as I can tell, they both achieve the same result yet the Custom SQL method takes longer to build.
You are correct in this assumption and, at least for this first point, if everything you need already exists in one table, then you would probably benefit more from a straight connection, however, what if your dashboard is comprised of charts that cover different aspects of your data? It would be tempting to just build this complete db model into your Tableau data model.
Join Culling
Tableau has this great feature called join culling designed specifically where larger data models are used: Instead of processing every table in the model, Tableau will re-write the query to use only the tables where the data resides and their connections (if required) which will significantly improve resources and, will allow users to build a single model.
So, with join culling, Custom SQL is looking less beneficial by the minute, again, why should I use it?
Join culling is a marvellous function as you can see:
| Query without join culling | Query with join culling |
|---|---|
Select From ft_Orders o Group By | Select From ft_Orders o Group By |
Join culling therefore substantially reduces the numbers of joins that need to be processed thus reducing the amount of data to be read and therefore, improving overall query performance
However, there is a catch. The Primary Key :: Foreign Key referential integrity constraint must be defined within the table definition in the database.
Referential Integrity
An important distinction regarding Referential Integrity Constraints is that they are usually always created and enforced in live production environments but crucially, are seldom used in reporting warehouses largely due to there being less of a requirement for processed and archived data.
So, in the absence of a referential integrity constraint between each of the tables, Tableau will be unable to use join culling therefore returning back to the highly inefficient Query without join culling method.
Control:
The Tableau data model expects the relationships between tables to be either 1:1, 1:Many or Many: 1; this is fine for most tables but, where the relationship is many:many meaning data must first be pre-aggregated before joining such tables, will result in a Cartesian join (each record joined to each record), which will be both costly in data performance and network load, but will also produce substantially inflated (yet completely wrong) final numbers.
2. Highly Optimised Queries
This links back to the items raised in point 1 above. When using the Tableau data model, it is only possible to see the query that Tableau has generated using either the Tableau Performance Recorder or, a data server query analyser, yet despite this, it is impossible to to control or modify / influence the query.
Contrast this to tested code.
When writing code, we can test it against the data server to identify and address performance issues; Tableau is unable to make such changes such that the code it generates could very likely impact data server and networks.
3. Parameterised Queries
Unique to Custom SQL, Tableau parameters can be inserted into the code which allows for greater control over queries and crucially, the amount of data passed back to Tableau.
This is especially true when connecting to a view.
Revisiting our "query without join culling" example above, imagine if this was converted into a view to make queries easier:
Whilst not usually as "dirty" as this, it is not uncommon for the BI team to create view's similar to the one above to simplify queries however now consider the use of filters.
We know for the Tableau Order of Operations that a Tableau filter is converted to a "Where" predicate during the query generation and so is processed with the query.
The query Tableau will generate to produce this will be similar to:
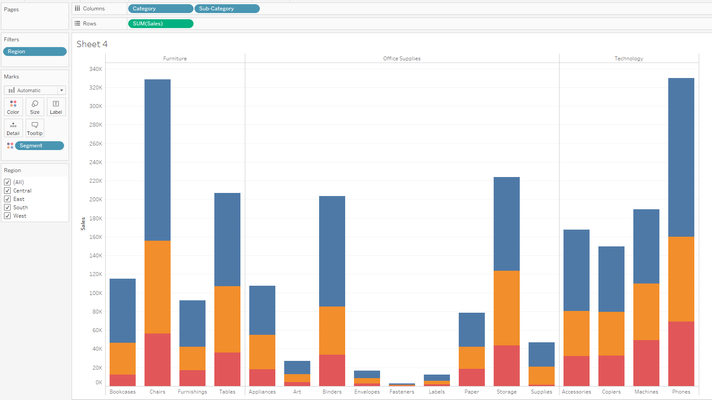
Now, if this is being used with a view instead of a table, the actual syntax as seen by the database engine will be (assume Category = Product, Sub-Category = Product Type and Segment = Division):
See where the filter has been placed - outside the raw data filter: Although filters are executed on the data side, they are usually only placed at the highest level of the query which means the data server will need to begin returning results and filtering them out as the data is returned, which can be a huge undertaking.
A view is the same as Custom SQL
I should add here that Custom SQL is functionally identical to a view except where the query is stored. There are other differences but these do not need to be discussed here.
Using Custom SQL on the other hand open's the door to greater flexibility such as:
- Using parameters as filters to control the query based on the parameter selection
- Create new performant control's such as case statements
- Dynamically select data based on how users want to cut the report without exposing too much information
- And to a lessor degree, accessing functions such as bitwise operations
4. Additive and semi-additive (Row-level) Calculations
Building on the parameterised querying above, writing SQL enable's analysts to create additional data from calculations. This will be discussed in further detail in the calculations article however, additive calculations such as case or "if..then..else" logic calculations or, are not ratio calculations will normally be built as a calculation to be executed at run-time which will add to processing time and unnecessary network load, however, by including them in your query, you can materialise the data which can add further benefits in regarding aggregated calculations.
5. Improved OLAP experience
OLAP (On-line Analytical Processing) - cubes require their own language to pull data from them; working with OLAP data is discussed in the knowledge base, however for Microsoft SQL Server, users are able to use OLAP data without needing to write MDX expessions and further, to be able to treat OLAP data as flat relational data instead.
This does require a properly configured connection using OpenQuery, and, if you are stuck with the correct MDX to use, the Excel OLAP PivotTable Extensions will certainly help-out here (https://olappivottableextensions.github.io/), code similar to:
Select a.* From Openquery(OLAP_Source,'Your MDX Query inside the two quotes')a
Will return the data from the cube and present it as though the data is relational.

