Test for filtering
Here's an interesting one: You have a situation that calls for a different outcome based on whether a filter is applied for example, say you have an aggregated % total calc that can only be applied when the data is at the same or higher grain than the % total calc, but for anything less, you need a secondary calc to run instead.
How would you go about testing whether a filter is applied?
Two methods are available direct from Tableau), with source-based alternatives too:
- Use a fixed LOD calc
- Use a self-blend (slower but can be more flexible)
Instructions
The easiest way to determine an output is to test for equality:
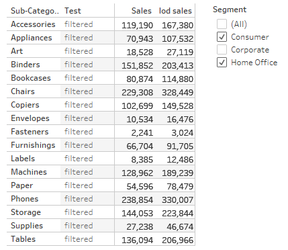
From the two image below, we can see that with no filter applied, both columns match however, as soon as the Segment filter is applied, the fields no longer match:
| Unfiltered | Filtered |
|---|---|
|
|
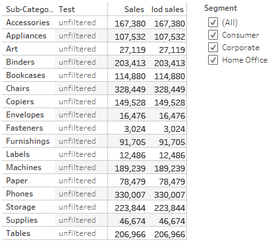
Create a fixed level-of-detail calculation "lod_Sales": {Fixed [Sub-Category]:Sum(Sales)}Create second calculation "Test": Iif(Sum(Sales) = Sum(lod_sales),'unfiltered','filtered')
- Placing the lod_sales and Test into the view, will enable you check the calculation and provide you with a start platform for further calculations.
The draw-back of this method is: that whilst this creates a quick and reasonably fast calculation, it will typically need to be created at the correct grain level or be fixed on all the possible dimensions, or at least hose in the view, otherwise, you will generate incorrect results
A more flexible albeit slower alternative method to the lod calc above could be to use the pre-2015 method of a self-blend:
- Right-mouse select your data-source and choose duplicate from the context menu
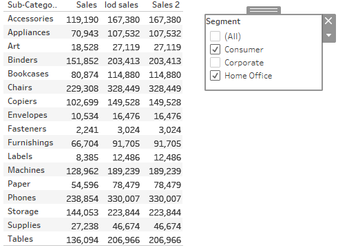
- in you primary source, create a calculation call it something like "Sales 2" and drag sales from the second set into the window - Tableau will add the necessary aggregation and referencing
- Going back to your first sheet, drag [Sales 2] onto the view, with no filters, all three columns should match
- Applying the filter, Tableau will filter the values of the primary set so the lod and sales 2 values will match and both will differ from the primary value:
- However, clearing the filter and then changing the row dimension from sub-category to city has led to this - can you see the difference:
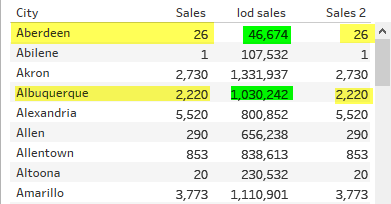
- Without adjusting the dimensions of the calculation, the lod calc has remained at the alternate grain whereas the self-blended value has switched in line with the dimensions
Hopefully these two methods will help you in solving this type of problem.
Related articles