Top N by Group
- Steve Martin
Example:
You would like to know the Top 5 sub-categories by sales value for each region.
You drag the Region and Sub-Category to the rows, add Sales to the text and sort Sub-Category descending by the sum of sales.
But then you realise, for all regions but East, the phones is appearing at the top of the group despite having a lower value and worse, this output is also affecting your Top 5 filter too:
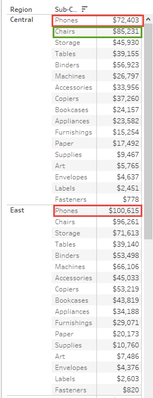
What's going on and how do you resolve it?
Explanation
This is part of Tableau's architecture, and how data is examined across groups.
If we go back one-step, and simply remove the Region from the view:
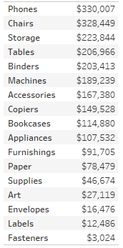
We see that Phones are indeed the best-selling item appearing at the top of the sorted view which helps us to understand what is happening.
From an SQL perspective, what we are actually seeing is the results of this query:
Select
[Sub-Category]
,Sum(Sales) As Sales

From Orders

Group By
[Sub-Category]

Order By
Sales Desc
Tableau Archictecure
Remember, under the hood, Tableau is ultimately converting actions and calculations to SQL expressions and communicating these to a database engine
But, adding Region makes no difference as to the output; this is down to the Scope of the data with, Sub-Category being more granular to that of Region, Sub-Category will take precedence as to determining the sort-order.
From a code perspective, all output items must be treated equally so in order to achieve a true order of values, you must first convert the above query to a derived table and then, set the order by on the sales:
Select
Region
,[Sub-Category]
,Sales

From (
-- Raw statement to obtain the values
	Select
	Region
	,[Sub-Category]
	,Sum(Sales) As Sales

	From Orders

	Group By
	Region
	,[Sub-Category]
)a

Order By
Region Asc, Sales Desc, [Sub-Category] Asc
Unfortunately, derived tables are not available to Tableau, so, how can we resolve this?
Resolution
By far the fastest and cleanest method to resolving would be to use the Rank() function and remove the sort entirely.
Rank, Index, First, Last, Lookup etc are Table Calculations so they are affected by calculations and filters as they are executed only against the data in the physical window space but, in doing so, this takes them away from the data-source which can make more complicated routines far more easier to create
Instructions
Create a new Calculation "Rank"
Rank(Sum(Sales),'desc')
- Drag your new calculation to the measures and adjust the scope to Sub-Category
- Drag your newly scoped rank to the rows and convert to discrete
- And now move the rank one-step ahead of Sub-Category: Notice how the rank order has adjusted to sequential
- Finally, hide the Rank calculation by removing the tick from the show header
Now, the sub-categories are on the correct order per region.
Being calculated, it is not possible to use the filtering editor to create a Top N however, it is possible to do so by creating a boolean output such as:
Rank(Sum(Sales),'desc') < 6
This has the added advantage of using a parameter to select measures to rank on
Workbook
Related articles